Stock Balance Applet
Purpose and Overview
The Stock Balance Applet provides a live, consolidated view of inventory quantities across your organization. It helps you understand what is on hand, where it is stored, and how balances change across locations.
Purpose: Provide a single source of truth for on-hand quantities by item and location.
Target Users: Warehouse teams, inventory controllers, purchasing and sales coordinators, and finance or audit teams.
Key Features:
- Real-time stock balance listing with grouping and pivoting
- Advanced search and filtering by item type, location, and balance
- Integration with inventory transactions across related applets
Key Features Overview
Who Benefits from This Applet?
Warehouse and Store Teams:
- Confirm stock on hand before picking and issuing
- Locate inventory by location
- Identify stock shortages early
Inventory Controllers:
- Monitor balance accuracy across locations
- Investigate discrepancies using listing filters and exports
- Standardize stock visibility across branches
Purchasing and Sales Teams:
- Validate availability before ordering or quoting
- Avoid overstocking by checking real-time balances
- Reduce missed sales due to inaccurate availability
Finance and Audit Teams:
- Verify inventory quantities for reconciliation
- Support audits with exports and related transaction documents
- Reduce write-offs by spotting anomalies early
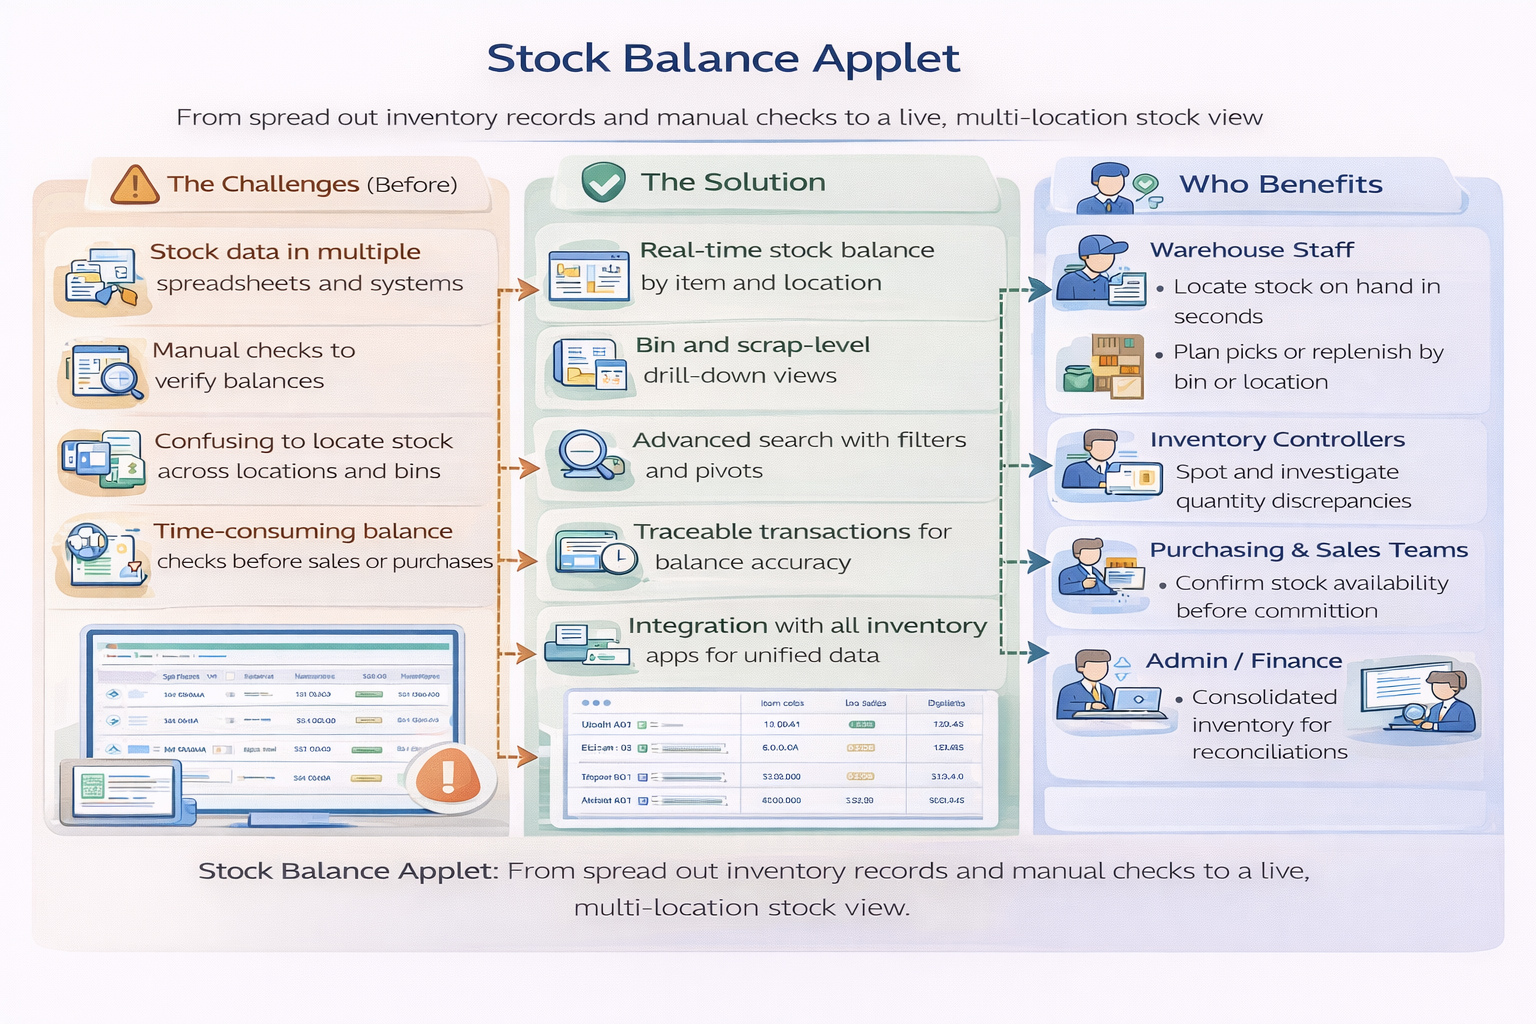
What Problems Does This Solve?
The Stock Visibility Problem:
- Stock data spread across multiple documents and teams
- Delayed updates after transactions
- Time-consuming balance checks before sales or purchases
The Stock Balance Applet Solution:
- Live balance view with item and location grouping
- Advanced filtering by item type and balance criteria
- Integration ready with all inbound and outbound inventory flows
Key Features Overview
Key Concepts
Understanding Stock Balance
Stock balance is the live quantity of an item in the system after all movements are applied.
| Term | Meaning |
|---|---|
| Opening Balance | Quantity on hand at the start of a period or snapshot |
| Inbound Movements | Purchases, returns in, adjustments in, transfers in |
| Outbound Movements | Sales, issues, adjustments out, transfers out |
| Current Balance | Opening + Inbound - Outbound |
Stock Balance Structure
Think of stock balance as a structured summary:
Organization
|
|-- Items
|   |-- Item Type / Sub Item Type
|   |-- UOM
|
|-- Locations
|
|-- Transactions
    |-- Inbound (GRN, Purchase, Return In)
    |-- Outbound (Sales, Issue, Return Out)
    |-- Adjustments
Flow Through the Structure:
- Item is the unit of tracking.
- Location is where the stock sits.
- Transactions are the source of truth for every balance change.
The “Golden Triangle” of Stock Balance
| Component | Analogy | Definition | Example |
|---|---|---|---|
| Item | The product | The SKU or inventory item being tracked | ITEM-001 |
| Location | The shelf | The warehouse or store holding the stock | WH-KL |
| Movement | The change | Transactions that increase or decrease stock | GRN, Sales, Adjustment |
When these three are aligned, stock balance is accurate and actionable.
Quick Start Guide
For Warehouse Staff: Check Stock On Hand
Goal: Confirm on-hand quantity for a specific item and location.
- Open Stock Balance from the sidebar.
- Use Advanced Search to filter by Location and Item Code.
- Click Search to load the listing.
- Review the Bal column to confirm current quantities.
- Use Column Toggle to reveal hidden columns (e.g., cost fields) if permitted.
- Export the grid if you need to share the results.
For Inventory Controllers: Investigate a Discrepancy
Goal: Trace a balance difference between system and physical count.
- Filter the listing by Item Code, Location, and Balance Greater Than 0.
- Review the Bal column for the current quantity.
- Use Column Toggle to group by Location for side-by-side comparison.
- Enable Pivot Mode if you need cross-tab analysis.
- Export the grid if you need to share evidence with auditors or finance.
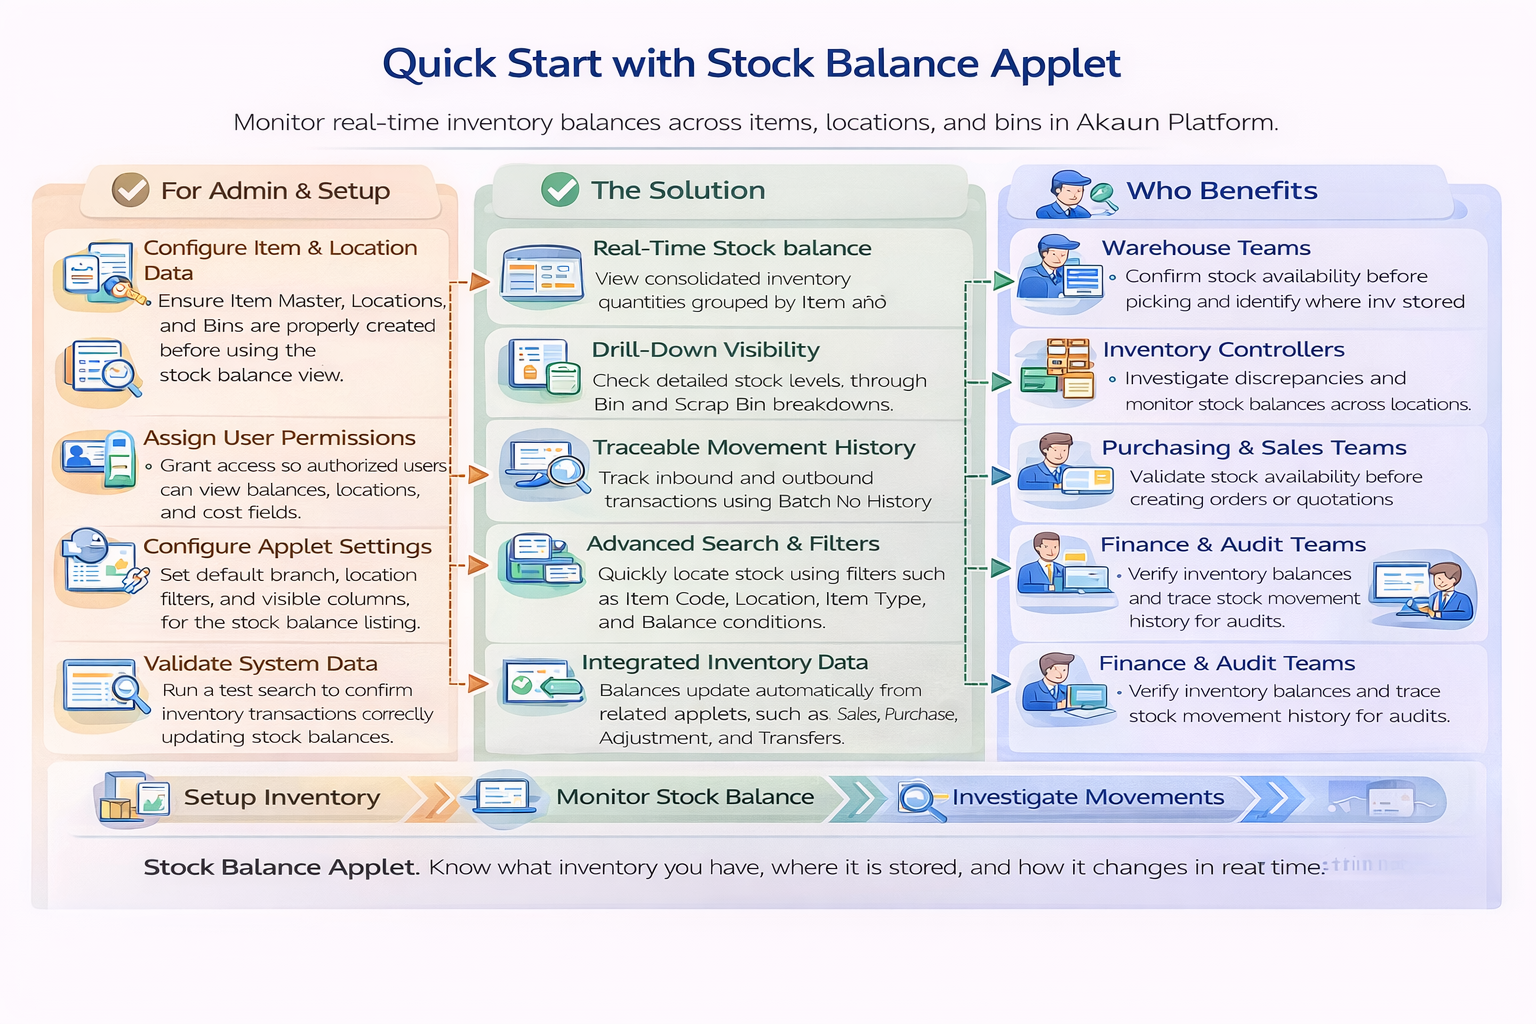
For Admins: Initial Setup
Goal: Ensure the applet is ready for daily operational use.
- Confirm Item Master and Location data are complete and accurate.
- Assign permissions so only authorized users can view sensitive costs or balances.
- Configure applet settings such as default branch, location, and column visibility.
- Validate that Settings and Permissions menus are visible for admins only.
- Run a test search to validate data accuracy and access.
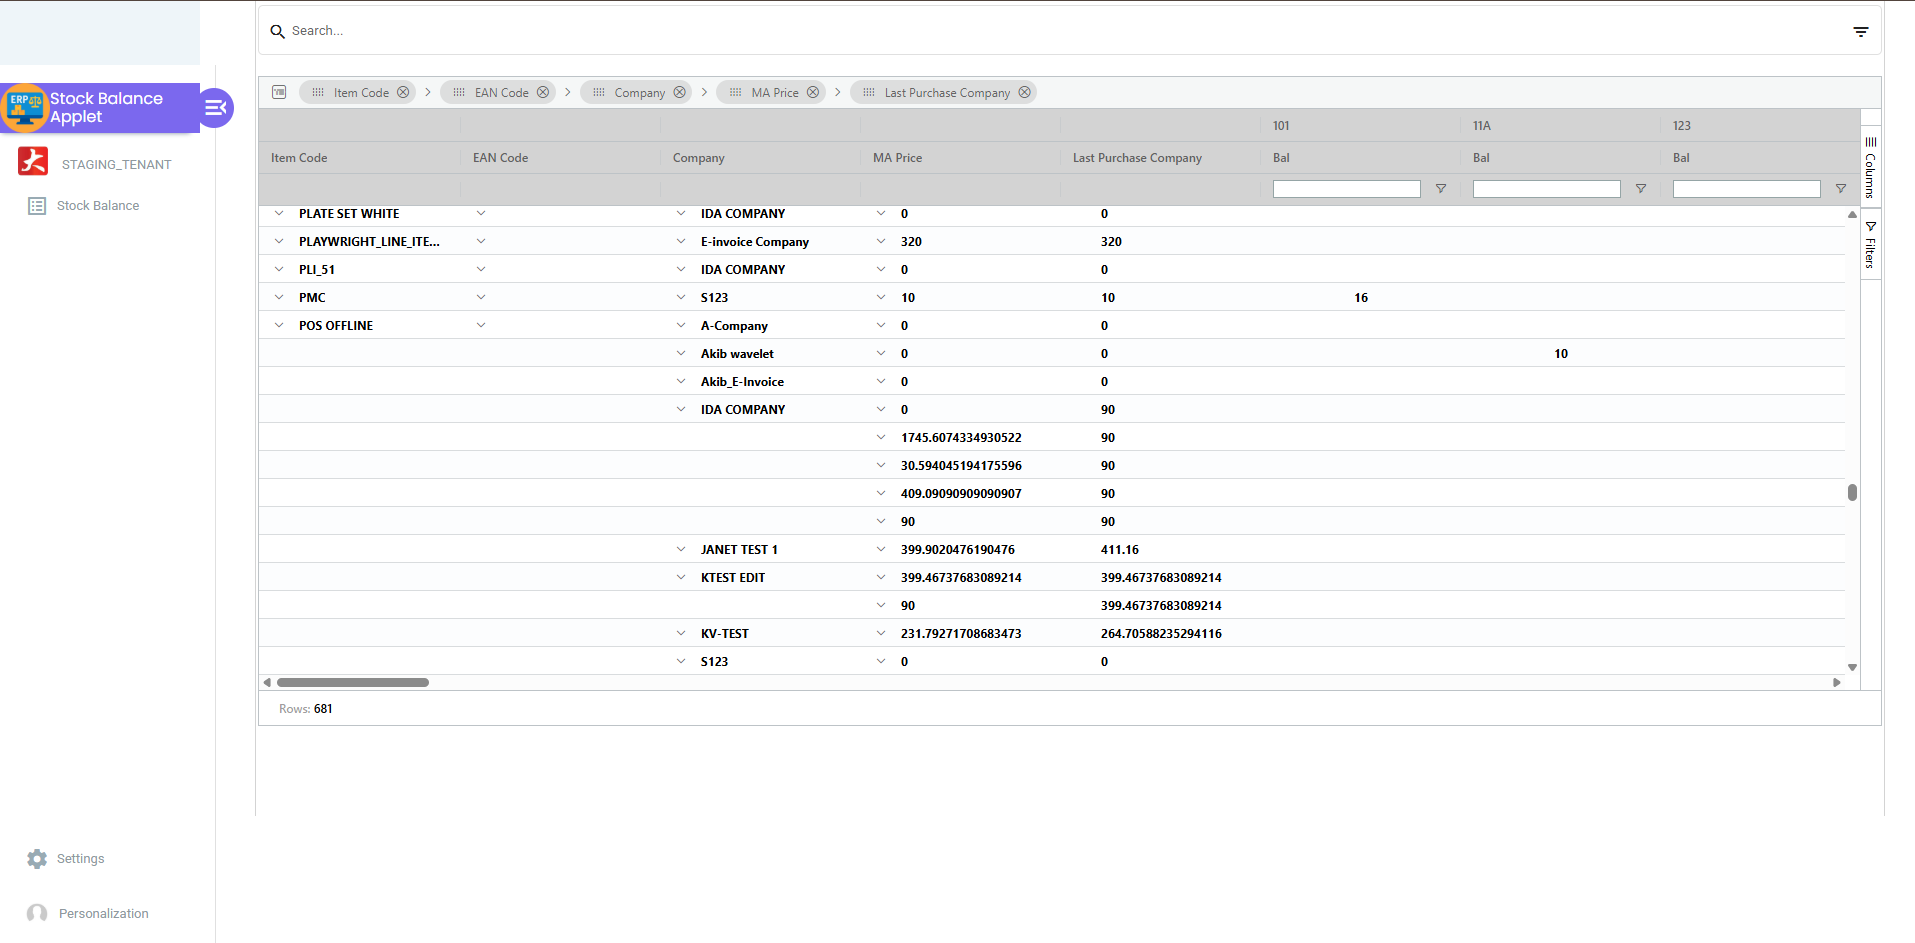
Stock Balance Listing
The listing is the operational dashboard for stock visibility. It groups items by Item Code and can pivot balances by Location for quick comparisons.
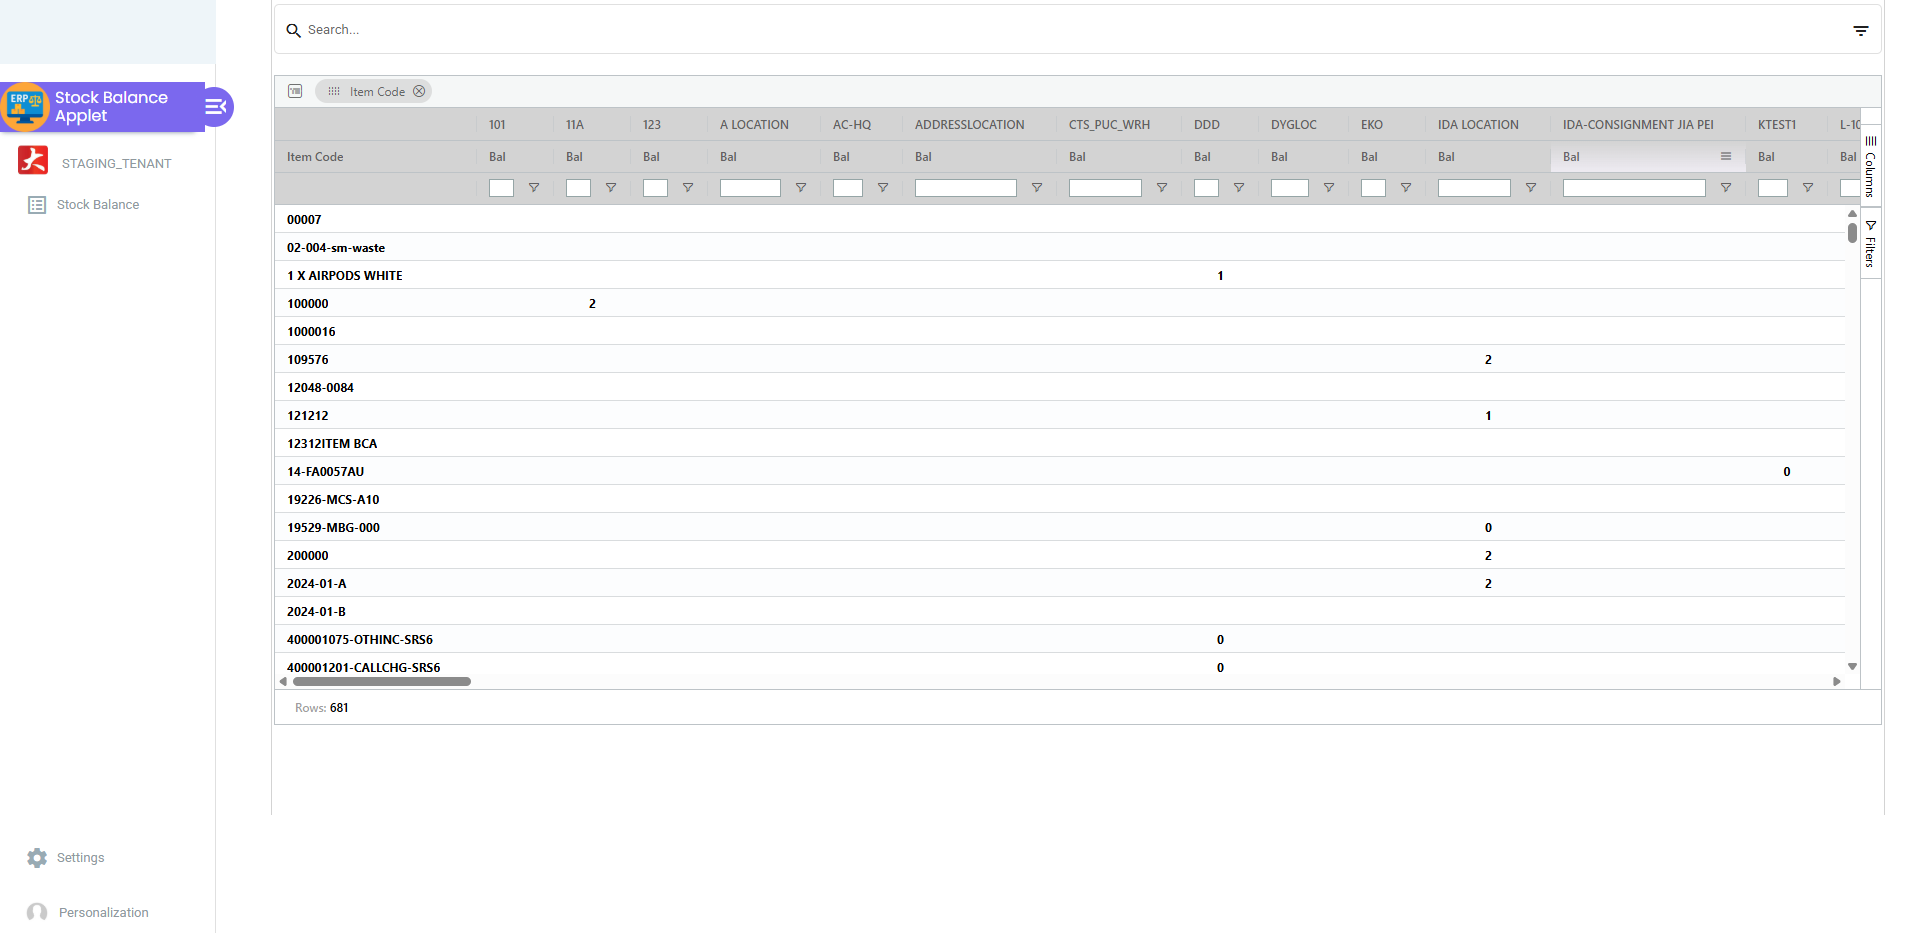
The listing can also group by EAN Code, Company, MA Price, and Last Purchase Company. Use Column settings to enable or disable these groupings.
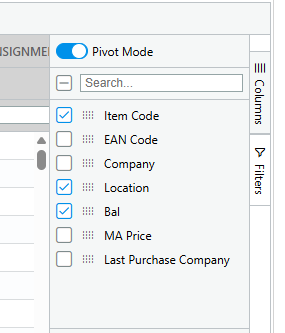
What is Pivot Mode? Pivot Mode restructures the listing so you can analyze stock balances by turning Location or other columns into grouped columns for side-by-side comparison.
What does it do? When enabled, you can drag fields into Row Groups, Columns, and Values to build a cross-tab view that highlights differences across locations.
Disabled vs. Enabled Pivot Mode:
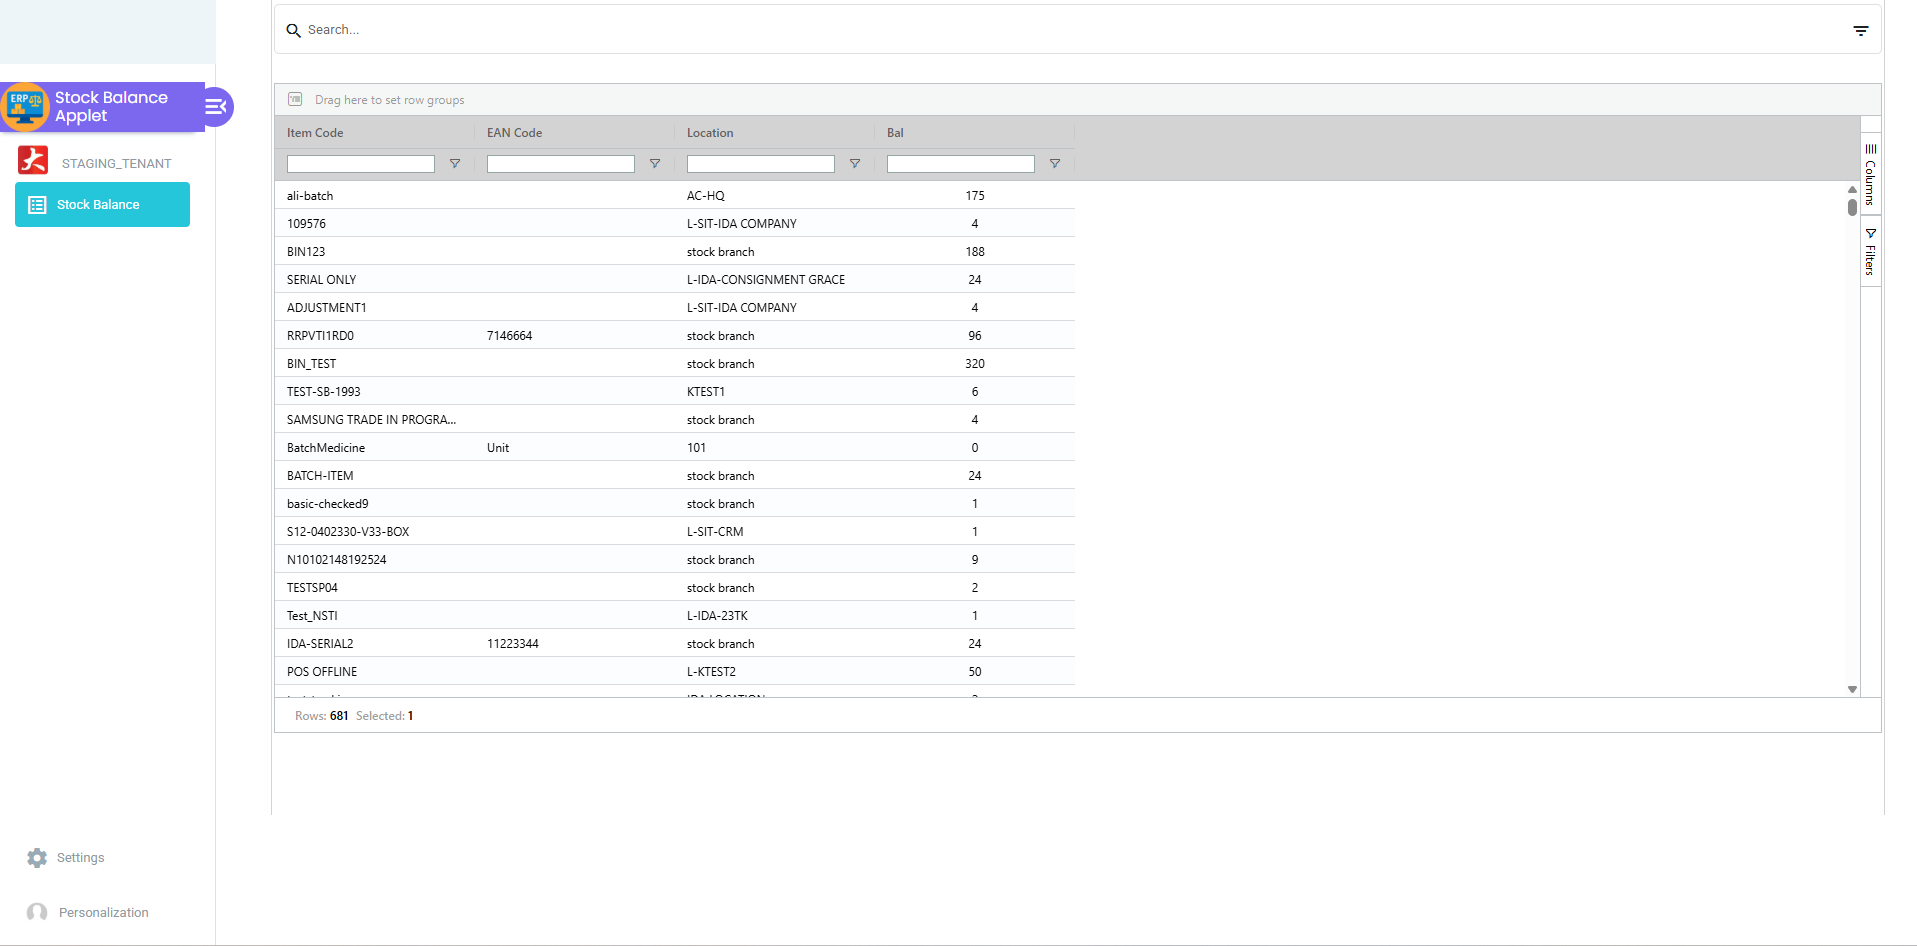
- Disabled: Standard row listing where each row is an item-location record, best for scanning and filtering.
- Enabled: Aggregated cross-tab view, best for comparing quantities across multiple locations.
Key Listing Columns:
| Column | Description |
|---|---|
| Item Code | Item identifier used as the main grouping field |
| EAN Code | Barcode or scan code for the item |
| Company | Company entity linked to the item |
| Location | Warehouse or store location |
| Bal | Current balance quantity |
| MA Price | Moving Average unit cost (visibility may be permission-controlled) |
| Last Purchase Cost | Latest purchase cost for valuation checks |
What You Can Do in the Listing:
- Group by Item Code to see totals across locations.
- Pivot by Location to compare stock distribution.
- Use the status bar for totals, selected row count, and aggregations.
- Enable charts and range selection for quick analysis.
- Export listing data to Excel or CSV when export is enabled.
Charts & Pivot
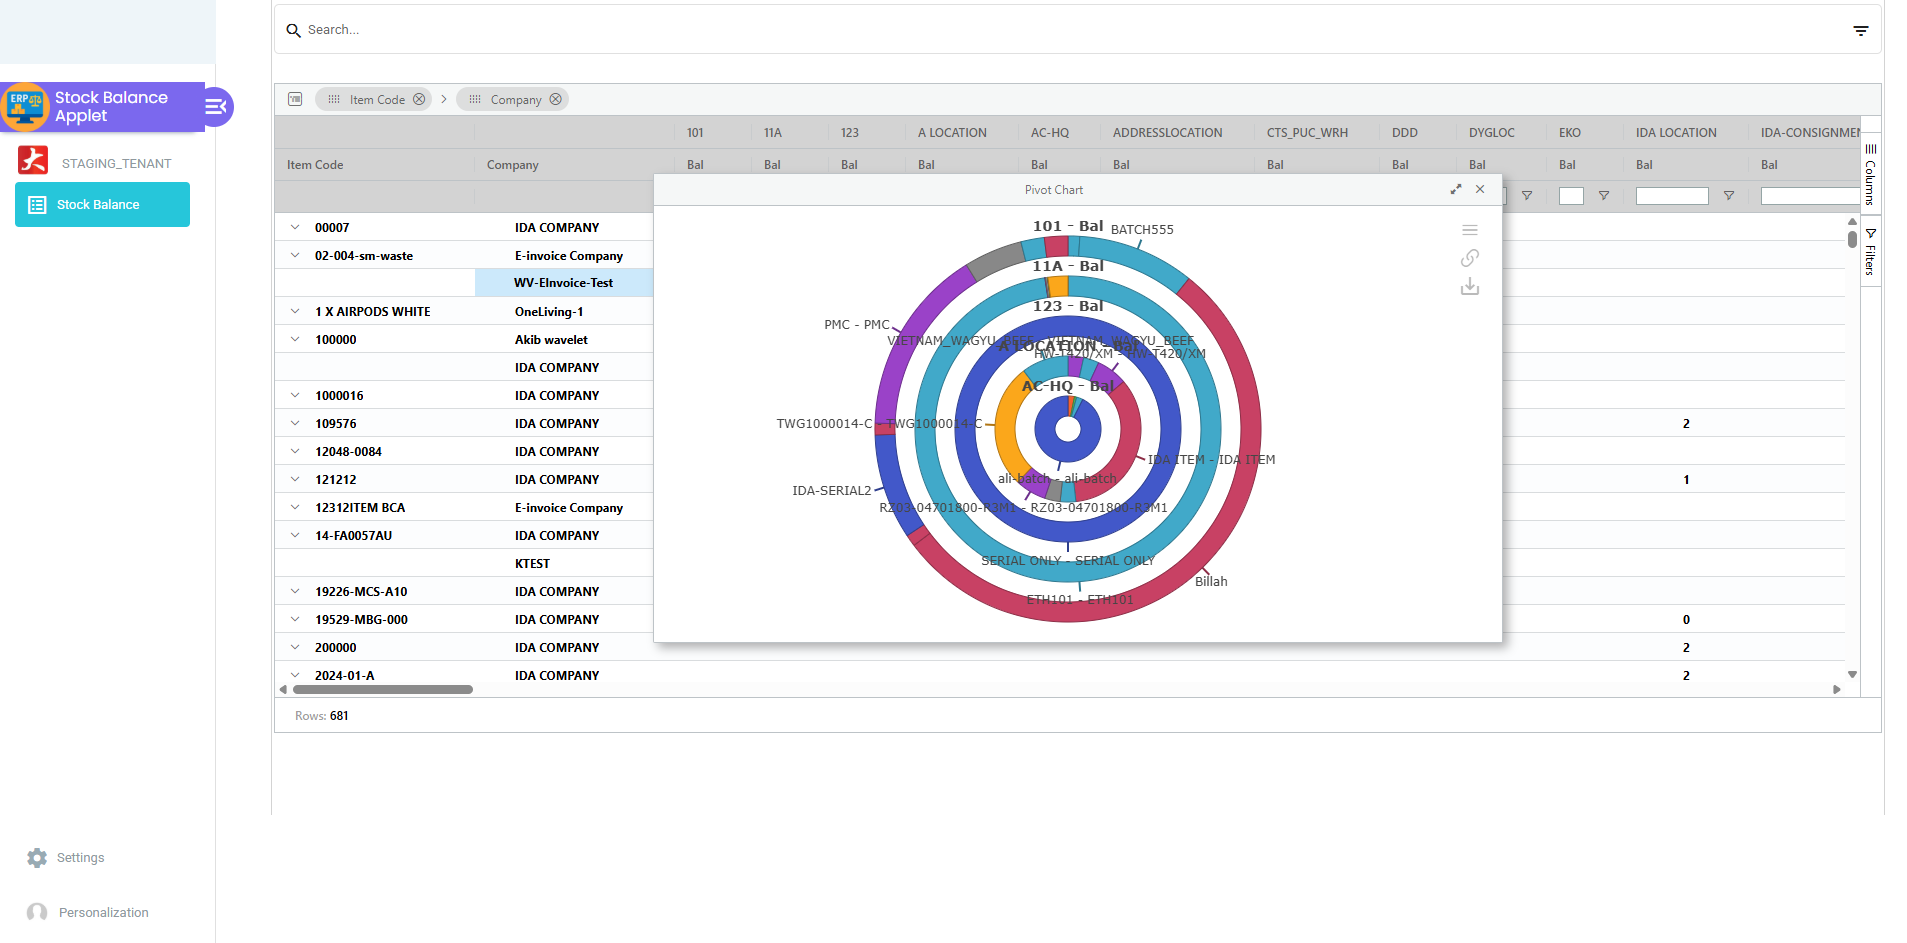
Use Charts and Pivot Mode to analyze stock distribution across locations and items.
Charts: Charts can only be generated when Pivot Mode is enabled. Select a range of cells and open the chart panel to visualize balances, compare locations, or track quantities by item group.
Pivot Mode: Drag fields into Row Groups, Columns, and Values to build cross-tab views for side-by-side comparison.
How to Generate a Chart:
- Enable Pivot Mode in the Column settings panel.
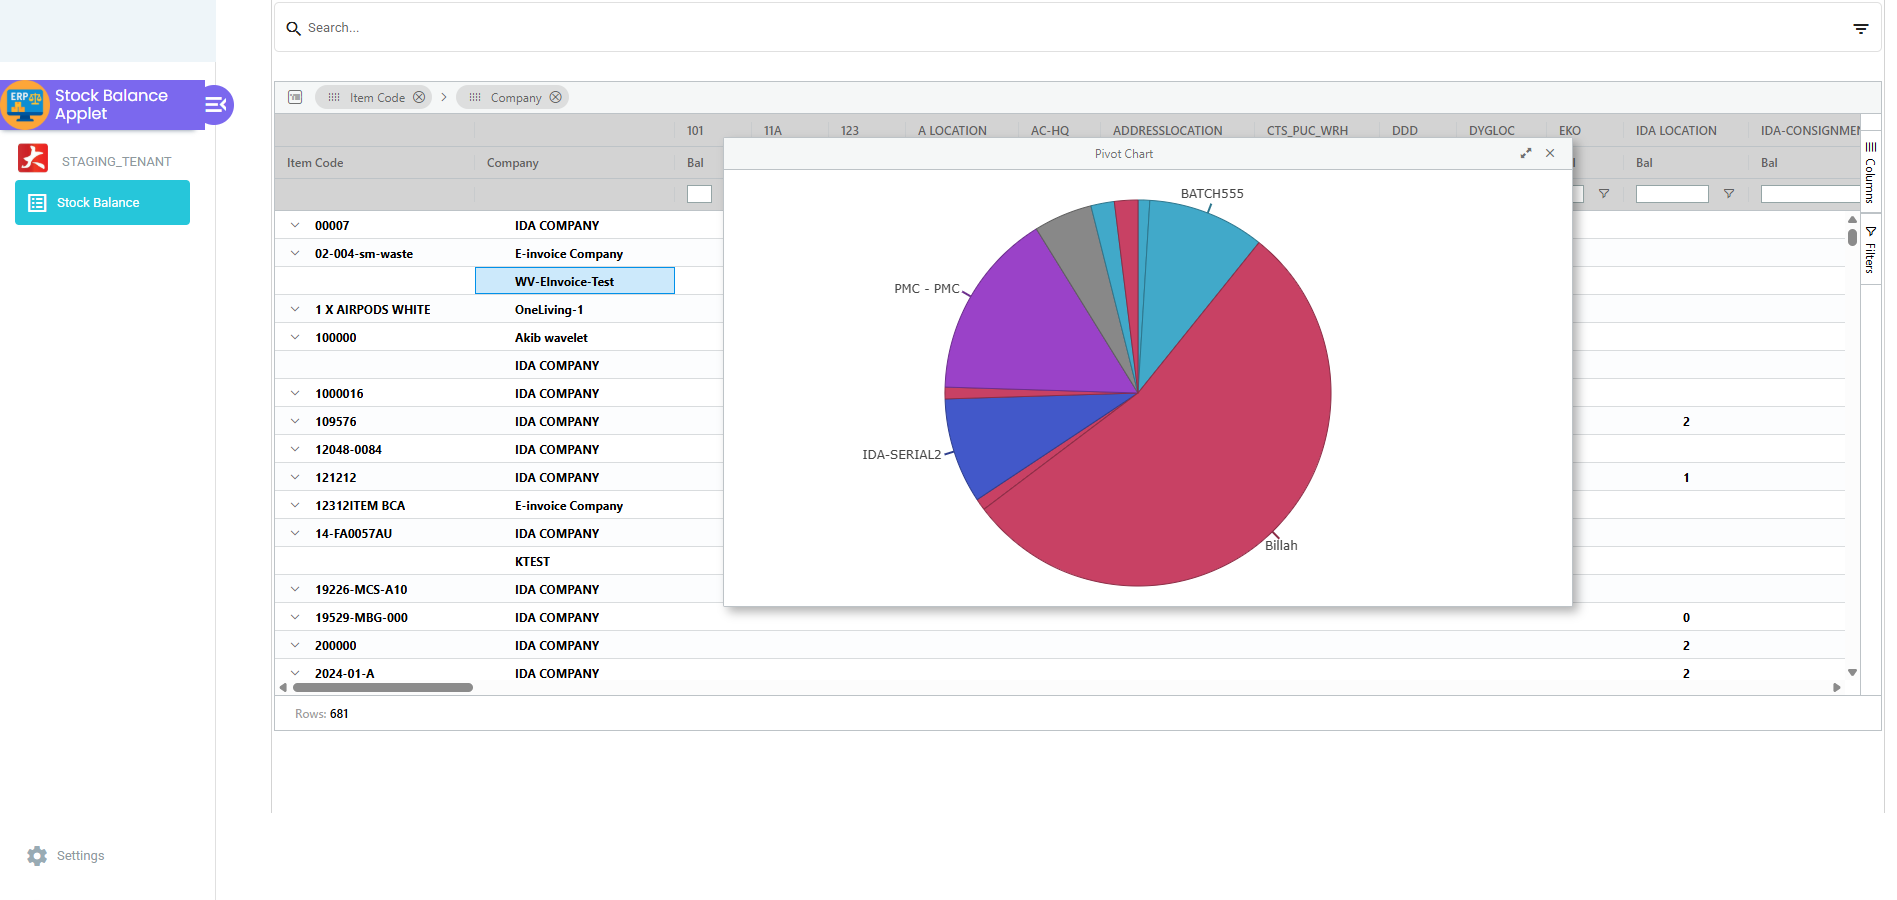
- Right-click in the listing and select Pivot Chart or Chart Range.
- Choose a chart type available in the applet, such as Donut or Pie.
Export & Analysis
Use Export to share the listing with other teams or use it in reconciliations.
Export Options:
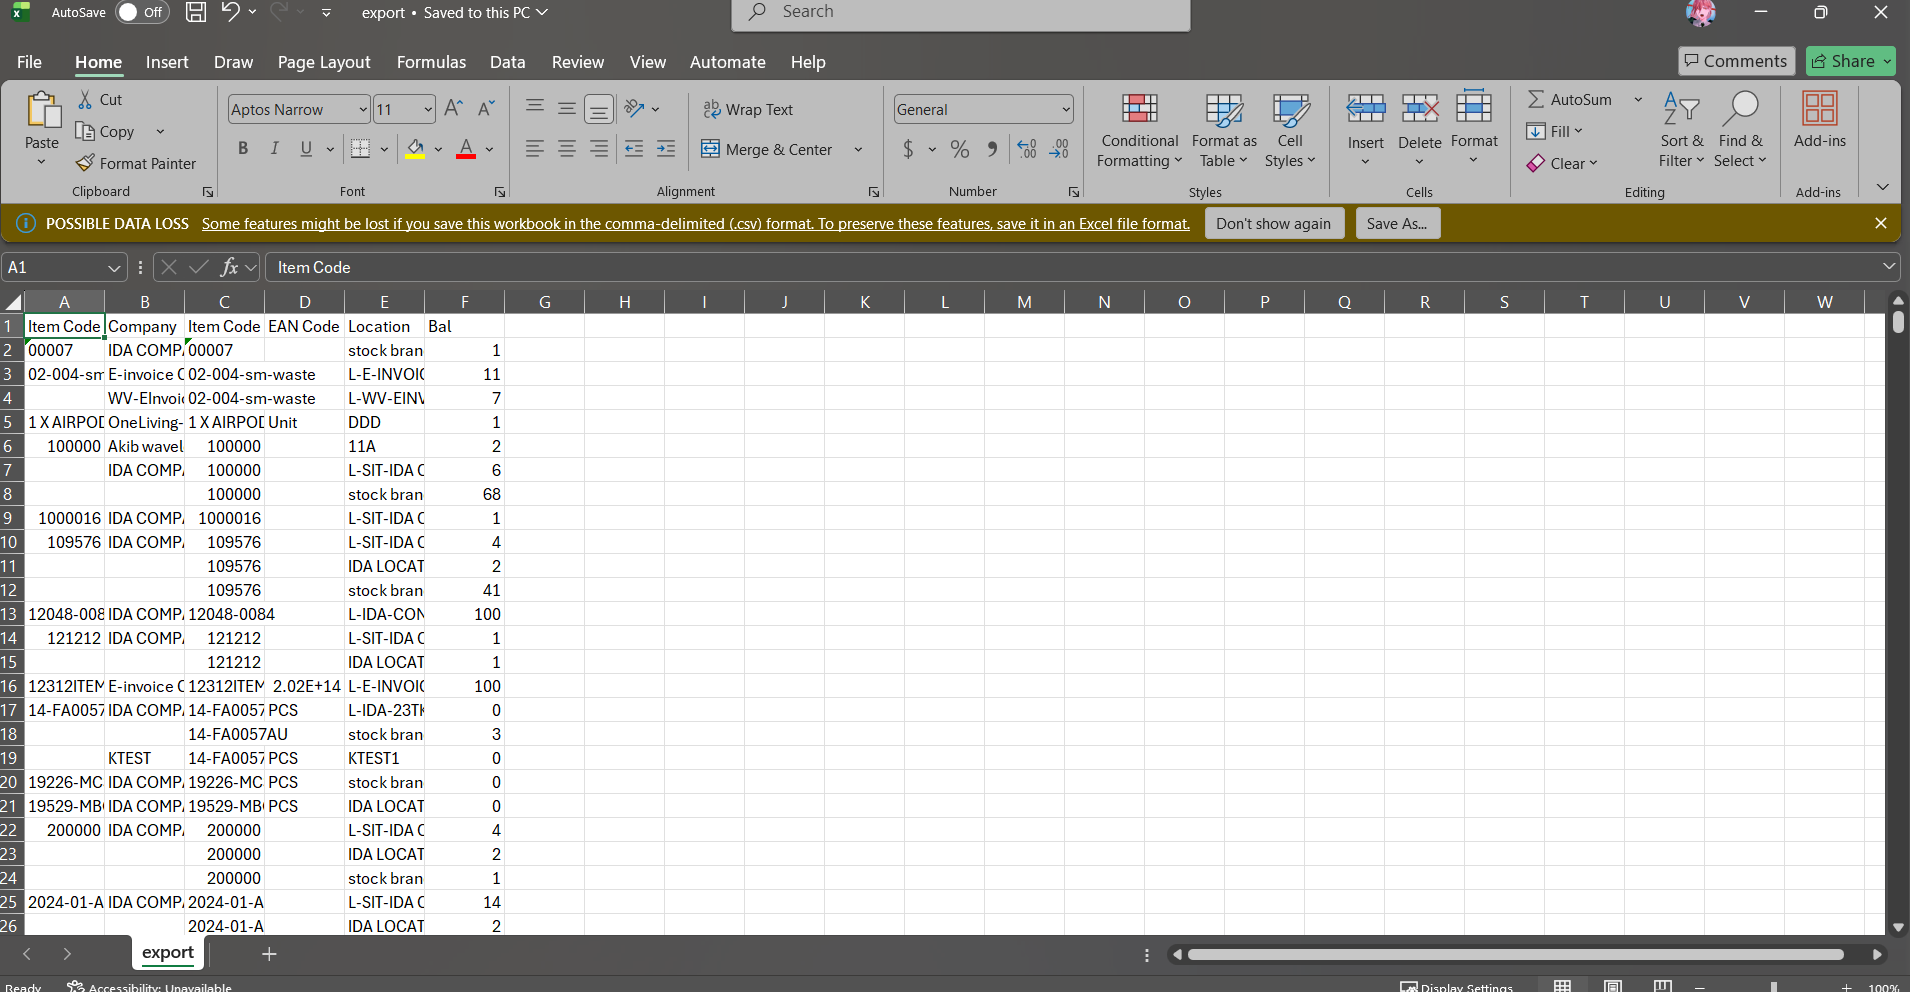
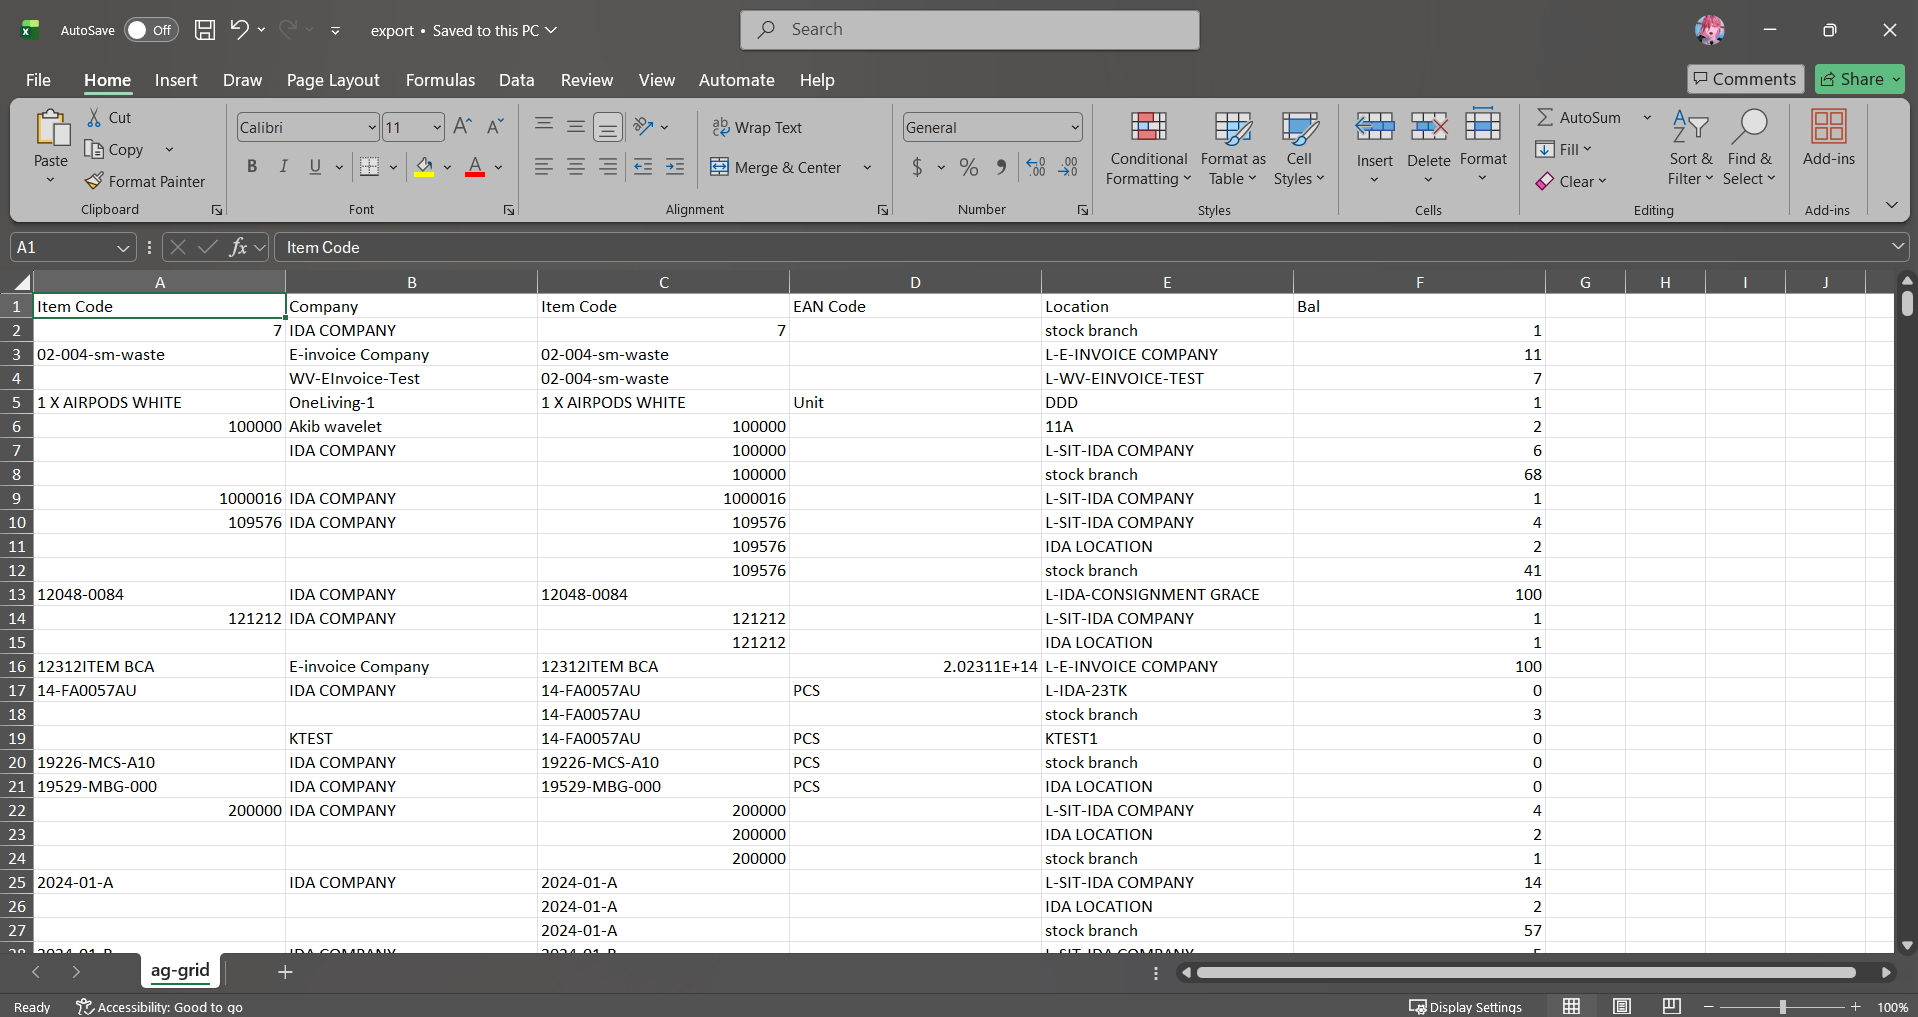
- Export to Excel or CSV for further analysis.
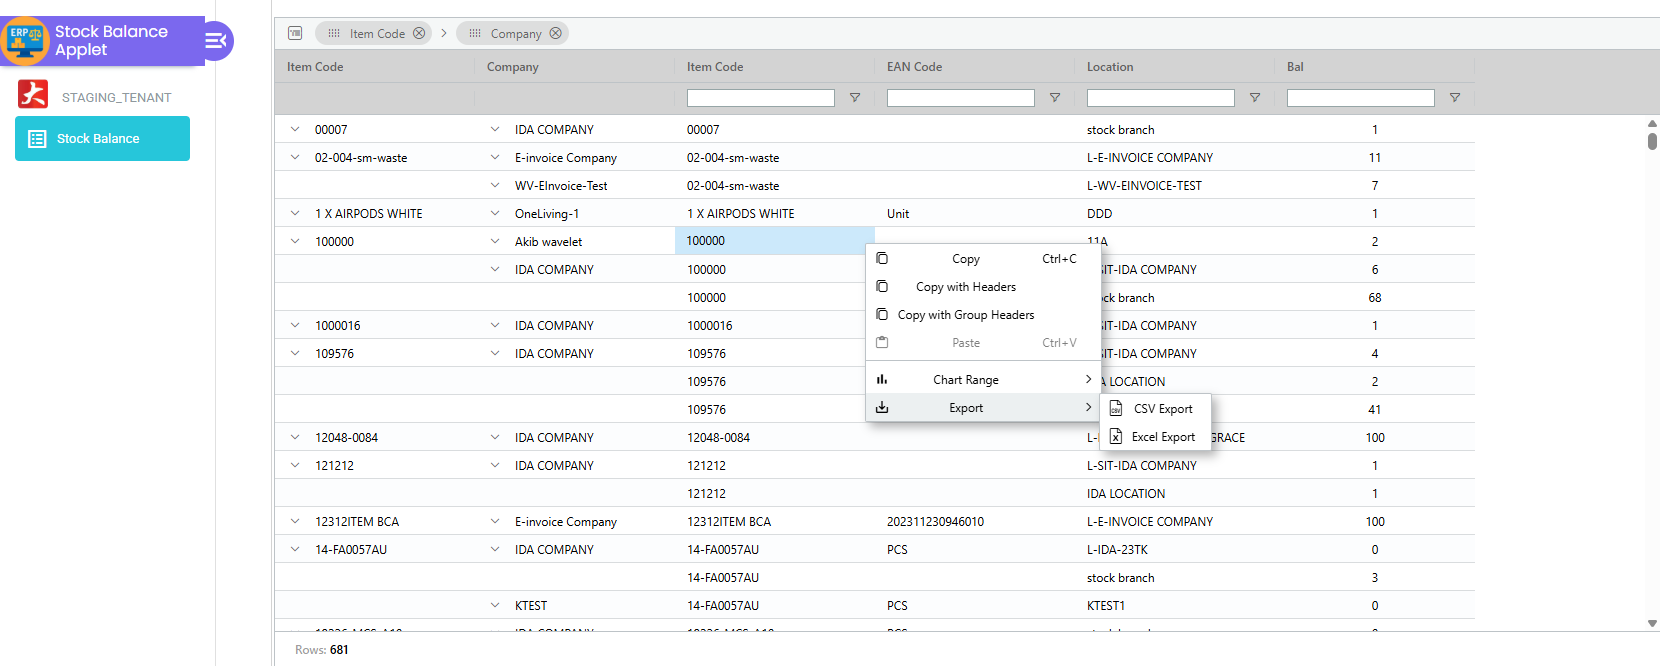
How to Export the Listing:
- Right-click anywhere in the listing.
- Choose Export, then select CSV or Excel.
- The exported file downloads automatically.
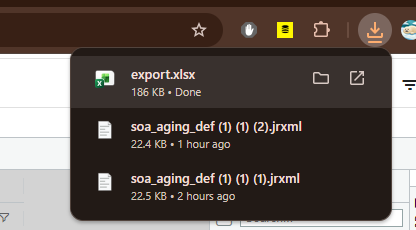
Exported Files:
Advanced Search & Filters
The Advanced Search panel lets you focus on the exact stock you need.
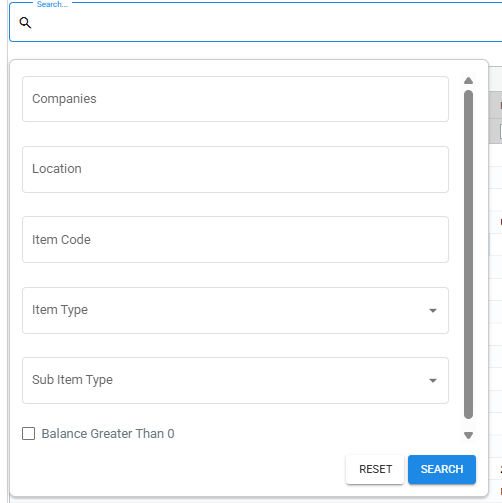
Available Filters:
- Company
- Location
- Item Code
- Item Type
- Sub Item Type
- Balance Greater Than 0
Item Types Supported:
BASIC_ITEMGROUPED_ITEMBUNDLECOUPONSERVICEWARRANTYBATCH_EXPIRYDOC_HEADER_ADJUSTMENT
Item Type Differences:
| Item Type | What It Means | Typical Use Case |
|---|---|---|
| BASIC_ITEM | A standard stock item tracked by quantity. | Regular SKU kept in inventory. |
| GROUPED_ITEM | A parent item that groups multiple child items. | Kits or sets sold as a group. |
| BUNDLE | A packaged combination of items sold together. | Promotional bundle (e.g., phone + case). |
| COUPON | A non-stock item representing a discount or voucher. | Gift vouchers or discount coupons. |
| SERVICE | A non-physical item delivered as a service. | Installation or maintenance services. |
| WARRANTY | A warranty or coverage item linked to sales. | Extended warranty plans. |
| BATCH_EXPIRY | Items tracked by batch and expiry dates. | Food, pharma, or regulated goods. |
| DOC_HEADER_ADJUSTMENT | Document-level adjustment line. | Rounding or header-level corrections. |
Sub Item Types Supported:
BASIC_QTYBATCH_NUMBERSERIAL_NUMBERBIN_NUMBER
Sub Item Type Differences:
| Sub Item Type | What It Means | Typical Use Case |
|---|---|---|
| BASIC_QTY | Standard quantity tracking without batch or serial. | General stock items tracked by quantity only. |
| BATCH_NUMBER | Quantity tracked by batch/lot number. | Perishable or regulated goods with batch control. |
| SERIAL_NUMBER | Quantity tracked by unique serial number. | High-value items with individual serials. |
| BIN_NUMBER | Quantity tracked by bin location within a warehouse. | Warehouses using bin-level location control. |
Search Tips:
- Use Item Code for exact SKU matches.
- Use Balance Greater Than 0 to hide empty items.
- Filter by Item Type to isolate specific inventory models.
Integrations & Data Sources
Stock Balance aggregates data from multiple inventory workflows and feeds downstream applets that rely on real-time availability.
Inbound Data Sources (Lines Imported From):
- Organisation Applet
- Item (Inventory) Maintenance Applet
- Doc Item Maintenance Applet
- Sales Invoice Applet
- Purchase Invoice Applet
- Sales Return Applet
- Purchases Return Applet
- Stock Adjustment Applet
- Sales Credit Note Applet
- Sales Debit Note Applet
- Purchase Credit Note Applet
- Purchase Debit Note Applet
- Internal Sales Goods Received Note Applet
- Internal Purchase Goods Received Note Applet
- Internal Sales Goods Issue Note Applet
- Internal Purchase Goods Issue Note Applet
Downstream Applets Using Stock Balance Data:
- Stock Availability Applet
- Inventory Admin Applet
- Sales Order Applet
- Packing Order Applet
- Delivery Order Applet
- Purchase Order Applet
- Purchase Requisition Applet
- Quotation Applet
- Sales Credit Note Applet
- Sales Debit Note Applet
- Purchase Credit Note Applet
- Purchase Debit Note Applet
- Sales Return Applet
- Purchases Return Applet
- Stock Adjustment Applet
- Internal Sales Goods Received Note Applet
- Internal Purchase Goods Received Note Applet
- Internal Sales Goods Issue Note Applet
- Internal Purchase Goods Issue Note Applet
Configuration & Settings
Configuration depends on your deployment and permissions. If Settings is enabled, administrators can configure defaults and field visibility.
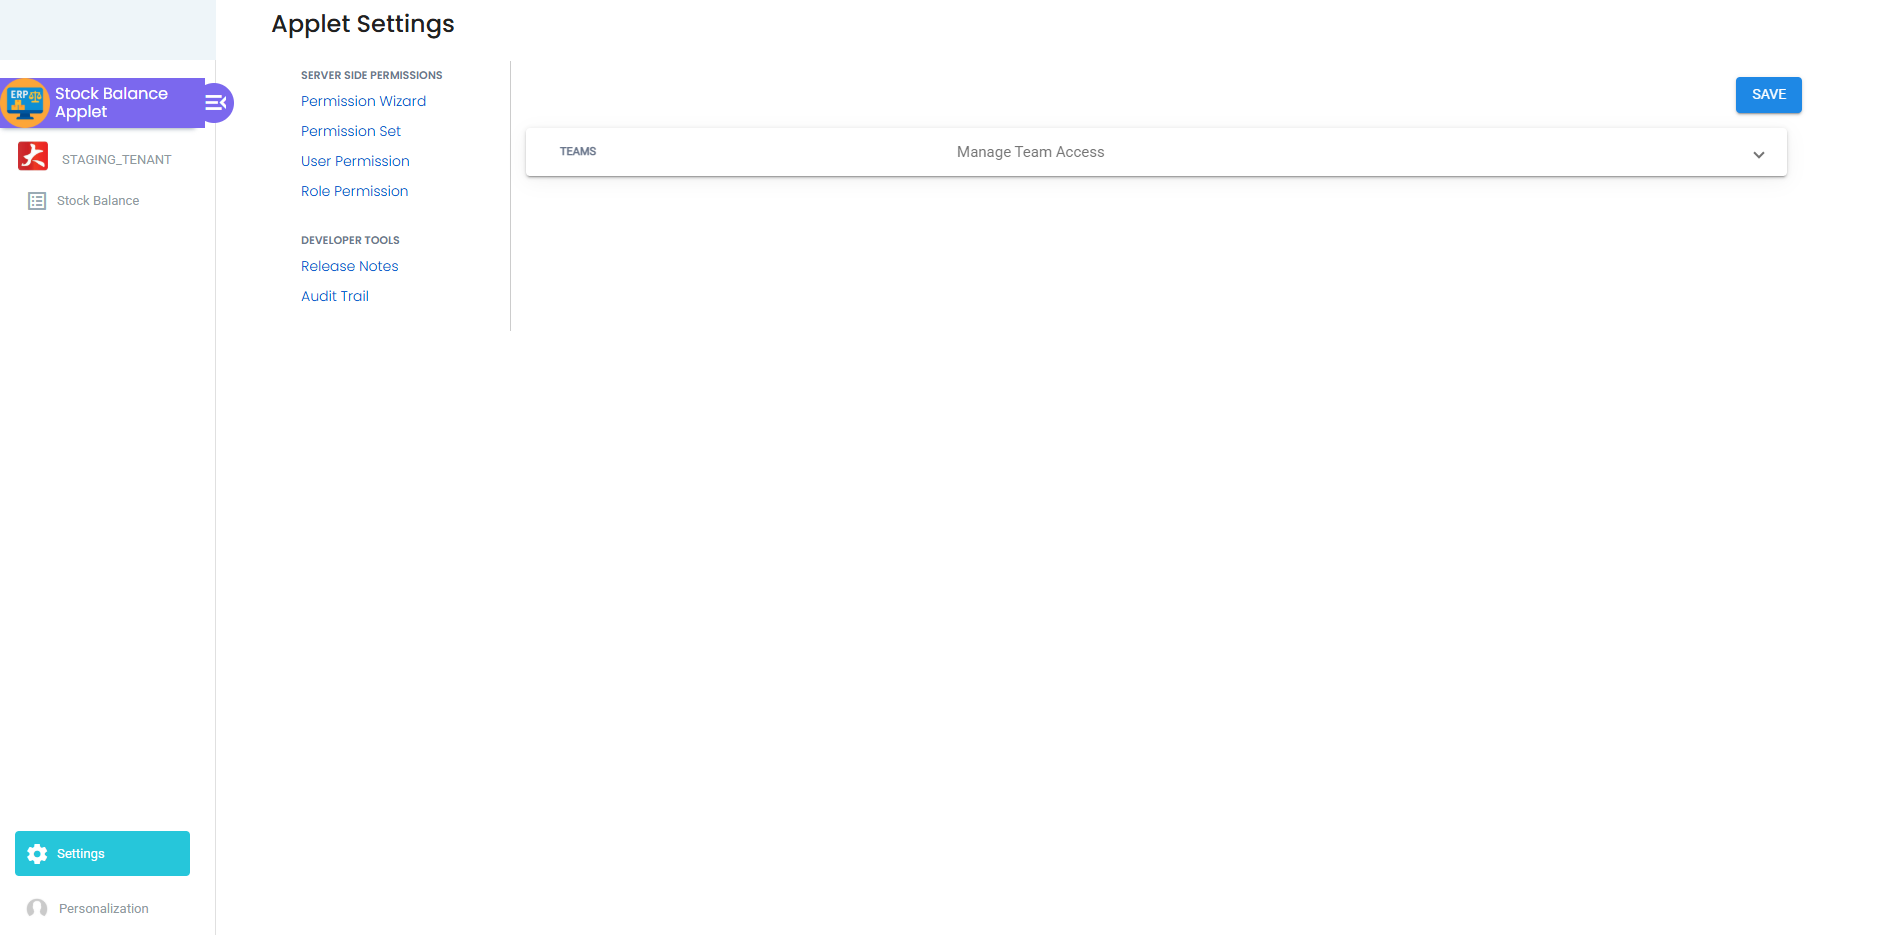
Permissions
Permissions control who can view balances, costs, and settings. Assign read and configuration access only to approved roles.
What You Can Control with Permissions:
- Access to the Stock Balance listing
- Visibility of cost-related columns (MA Price, Last Purchase Cost)
- Access to applet settings (defaults, column visibility, and configuration)
Where to Configure:
- Use Role Permissions to apply access rules to job roles.
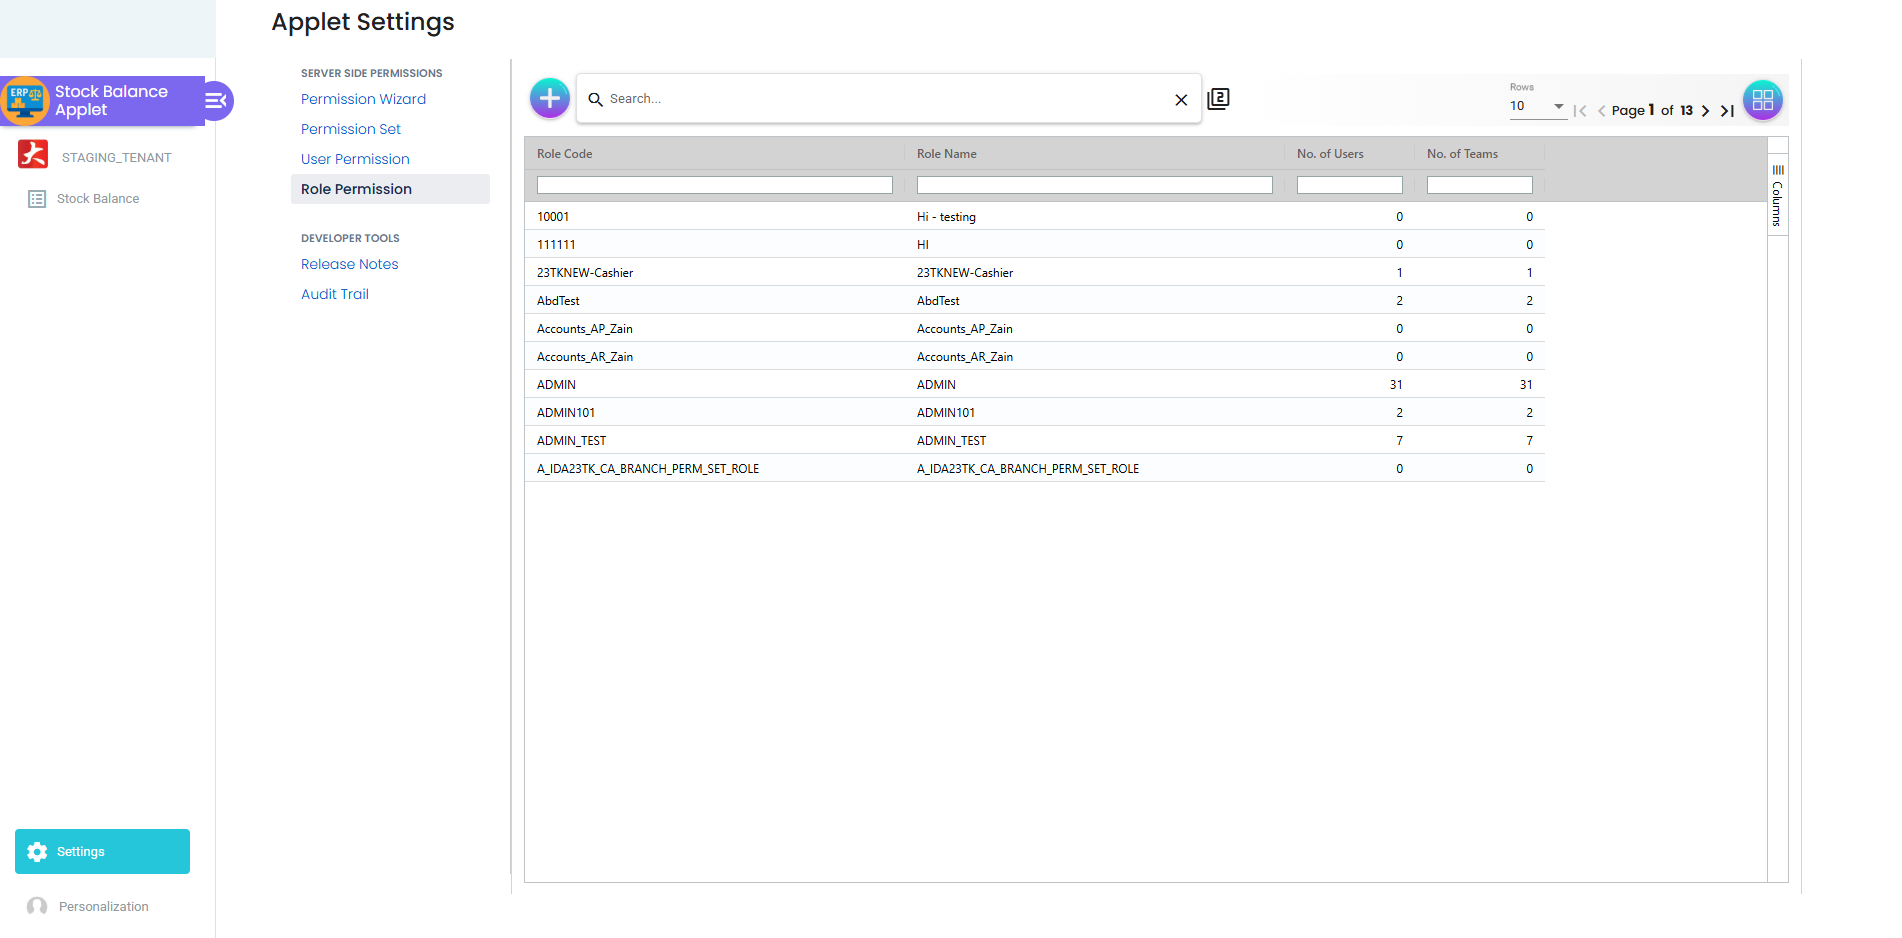
Role permissions for the stock balance applet. - Use User Permissions for exceptions or specific user access.
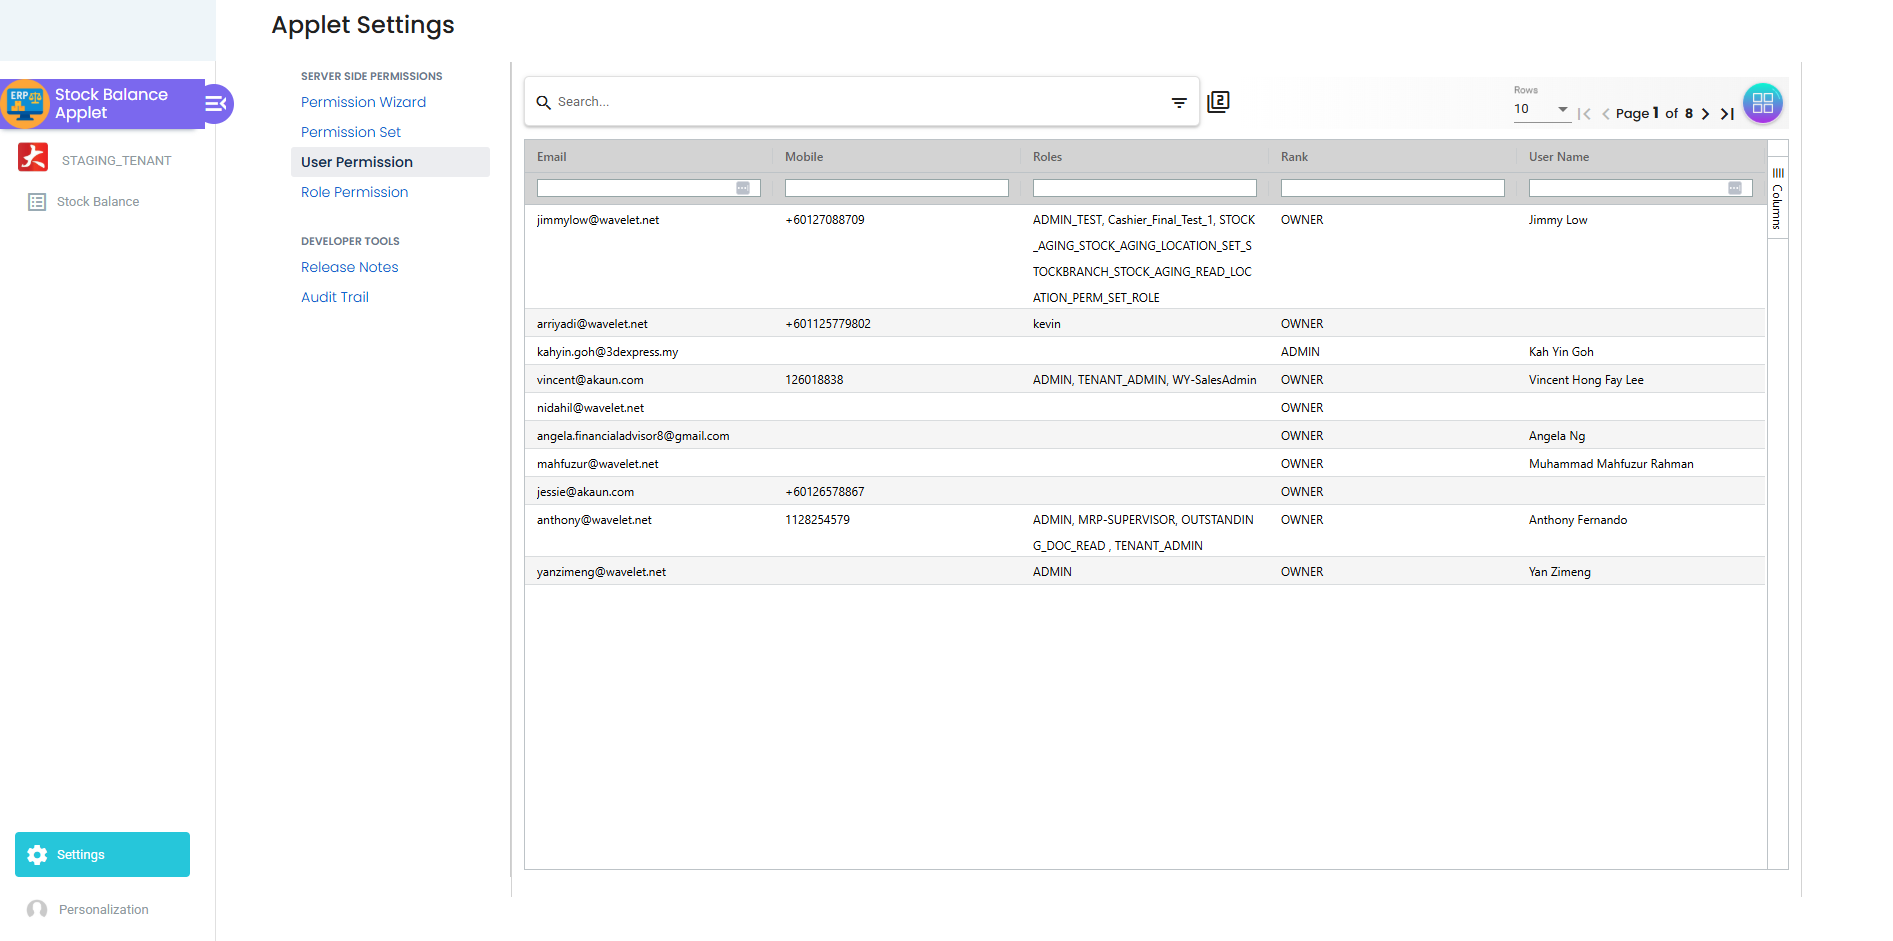
User permissions for the stock balance applet.
FAQ
Q: Why is my stock balance showing zero? A: Check your filters first. The Balance Greater Than 0 filter hides zero-balance items. Also verify the correct Location and Item Type are selected.
Q: Why do I not see a specific location or company? A: Location visibility is permission-controlled. Contact your admin to confirm your access rights and location assignments.
Q: Why can’t I see MA cost or last purchase cost columns? A: Cost fields are typically permission-controlled and can also be hidden in applet settings. Ask your admin to enable the relevant visibility and permissions.
Q: How is the stock balance calculated? A: Stock balance is derived from all inbound and outbound transactions applied to the item and location. The system updates balances as transactions are posted.
Q: Why can’t I generate charts? A: Charts are available only when Pivot Mode is enabled. Enable Pivot Mode in the Column settings panel, then select a range and choose Pivot Chart.
Q: Why does my export option not appear? A: Export options may be disabled by permissions or admin settings. Confirm that your role allows exports and that the grid is not locked by policy.
Q: What is the difference between the Stock Balance Applet and Stock Report Applet? A: Stock Balance focuses on live operational visibility and listing analysis. Stock Report provides broader analytics, historical views, and reporting outputs.
Q: Why do I see negative stock? A: Negative stock usually indicates timing differences, backdated transactions, or missing receipts. Review recent sales, purchase, and adjustment documents for the item and confirm whether negative stock is allowed in your configuration.