Stock Report
Twelve read-only reports over the stock ledger: movements, aging, balances by location or at a past date, and stock value. When two closing figures disagree, check what each was made from first: some reports recompute from the stock ledger when you run them, others read a stored balance row that only shows now, and they value at the company or the location average. Inventory reports sets out each one.
Overview
The Stock Report applet is the read-only reporting front end for inventory. It reads the stock transaction ledger, the item-location balances and the item master, and presents twelve reports: where stock moved, how old it is, what each location holds, what the balance was on a past date, what was bought and sold per item, and the stock value by category level. Nothing in it creates, edits or posts a document.
Warehouse managers open it to trace movements and count discrepancies; finance opens it for closing-stock values and gross profit; purchasing for sales-versus-purchase and last-purchase-price checks. Every report shares the same layout — an Advanced Search panel, a column toggle, an interactive grid with grouping and totals, and Excel / PDF export from the status bar.
Where it fits
| Direction | Applet / document | Why |
|---|---|---|
| Upstream | Every stock-moving document — sales invoice / cash bill / return, purchase invoice / GRN / return, Stock Transfer, Stock Adjustment, consignment. A Supplier RTV in Internal RMA is not one: by design it is the return record, and the Purchase Return moves the stock | Each writes one signed line to the stock ledger the reports read |
| Upstream | Inventory Item Maintenance / Doc Item Maintenance | Item type, sub-type, category levels 1–10, EAN, UOM |
| Upstream | Pricebook | Pricing schemes shown on the Stock Balance Pricing Report |
| Upstream | Organisation | Companies, branches, locations and location labels used as filters |
| Sibling | Stock Balance, Stock Availability | Live per-location balance and availability; this applet is the historical and analytical view |
| Downstream | Financial Report | Closing stock value in the ledger should agree with the Stock Balance / Summary by Location closing values |
Modules: Inventory, Financial Accounting.
Screens and menus
| Menu | Route | What it shows |
|---|---|---|
| Stock Movement Report | stock-movement-report | Every stock ledger line, grouped by item, with running balance |
| Stock Aging Report | stock-aging-report | Remaining quantity and value by age bucket |
| Stock Summary Report By Location | stock-summary-report-by-location | Opening, purchase, sold, adjustment, others, in-transit, closing per item and location |
| Historical Stock Balance | historical-stock-balance | Balance and MA value as at a past date |
| Stock Sales And Purchase By Item Code | stock-sales-purchase-by-item-code | Sales vs purchase quantity and amount, GP, stock-turn ratio |
| Stock Value By Level Report | stock-value-by-level | Quantity and value pivoted by category level and location |
| Batch and Expiry Date Report | batch-expiry-date | Batch quantities in expiry buckets |
| Stock Balance Report | stock-balance-report-new | Current balance with MA and last cost per company |
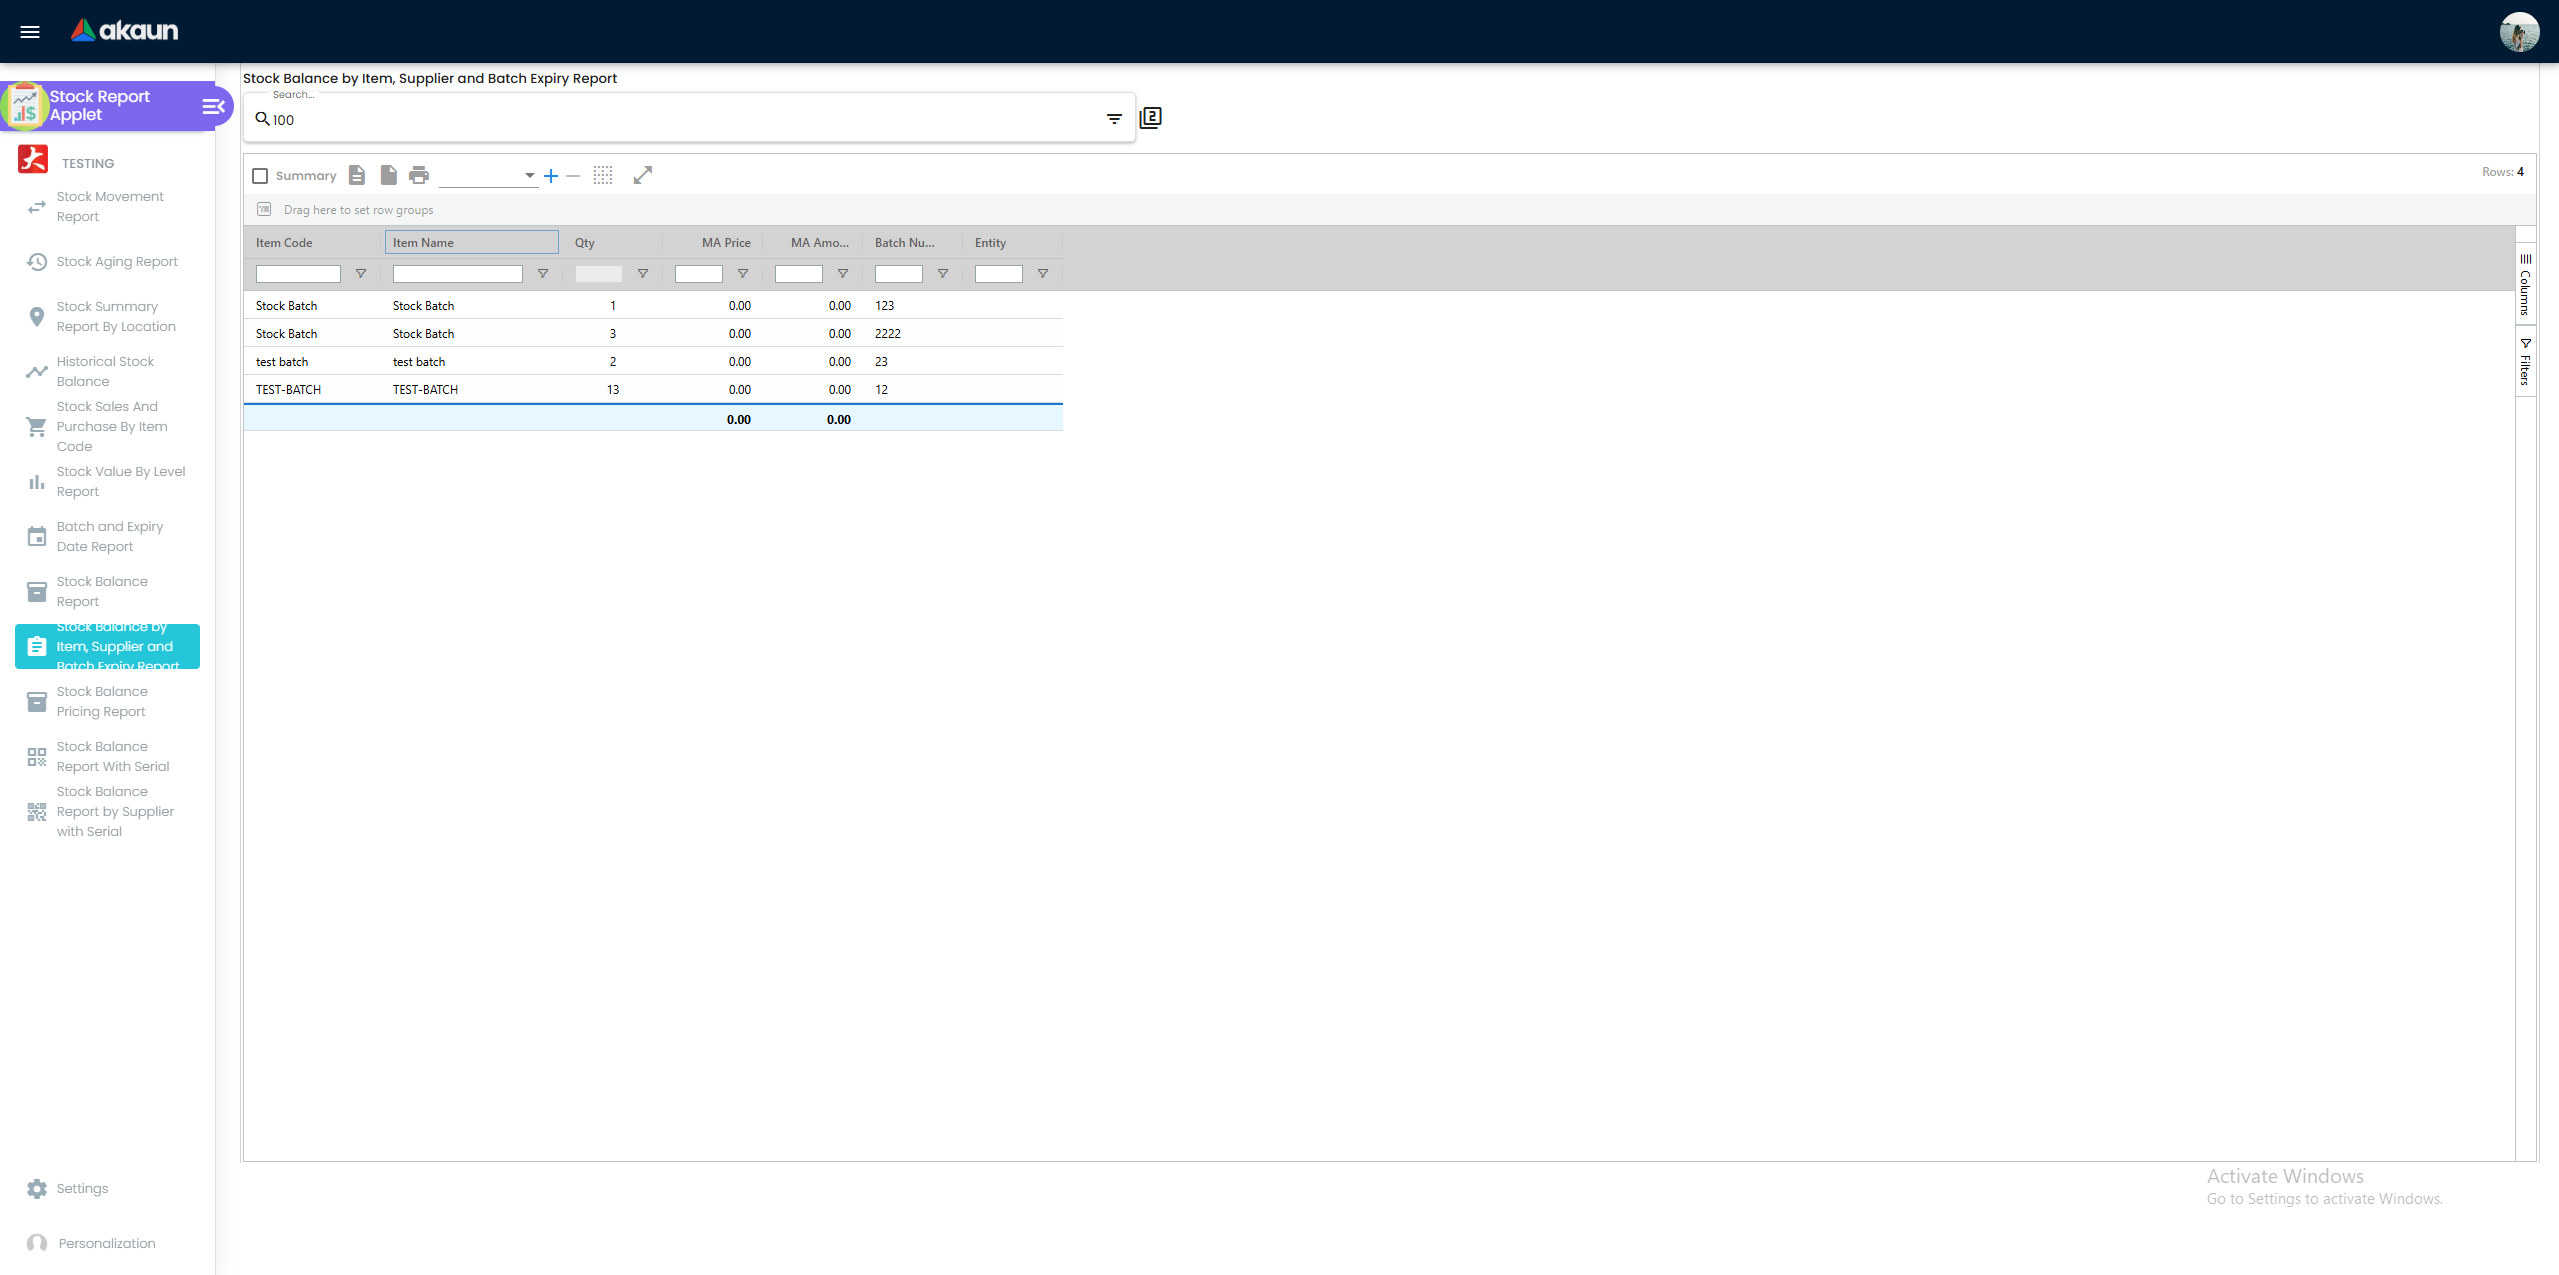
| Stock Balance by Item, Supplier and Batch Expiry Report | stock-balance-supplier-serial-batch | Balance per item, supplier entity and batch with MA value |
| Stock Balance Pricing Report | stock-balance-report | Current balance with the item’s price-book prices, tax codes and costs |
| Stock Balance Report With Serial | stock-balance-report-with-serial | Balance per location with serial list, add / subtract and stock count |
| Stock Balance Report by Supplier with Serial | stock-balance-report-supplier-serial | Balance traced to the purchase document, supplier and serials |
An Item Price Change Report route exists but its menu entry has been removed.
A thirteenth report exists in the source, not on your screen. The applet’s source gained Stock Purchase Report by Supplier on 2026-09-25: finalised purchase invoices and purchase returns listed by supplier, item, location and date, returns shown as negative quantities and amounts so a supplier’s total is net of what went back. The build served on 2026-10-06 does not include it, so this page does not say when you will see it. As the source stands, it needs its own read permission (API_TNT_DM_ERP_STOCK_PURCHASE_REPORT_BY_SUPPLIER_READ, or _ADMIN / _OWNER), and no show menu permission is registered for it — so once its menu is hidden in Application Settings, no permission brings it back for an individual user; clearing the setting is the only way. Gear (Settings) menu: Application Settings, Default Selection, Aging Period Settings, Custom Resource Bundle Configuration, plus Webhook, permission listings, Release Notes and Applet Log. Personalisation: per-user Default Selection.
Common controls
Every report opens with Advanced Search: location (multi-select; when you pick none, the report asks for the locations your read permission covers), item code keyword (three characters or more), item code range, item type, item status, item category levels, date range, and location labels. Each report adds its own options — Hide Voided Documents and Include SN Adjustment on the Movement report, Show Zero Balance and Show Serial Numbers on Historical Stock Balance, Show Zero Balance on Stock Balance, Hide Zero Quantity on Stock Balance With Serial, and Option Balance (positive, zero or negative) on the Stock Balance Pricing Report.
Stock Movement Report
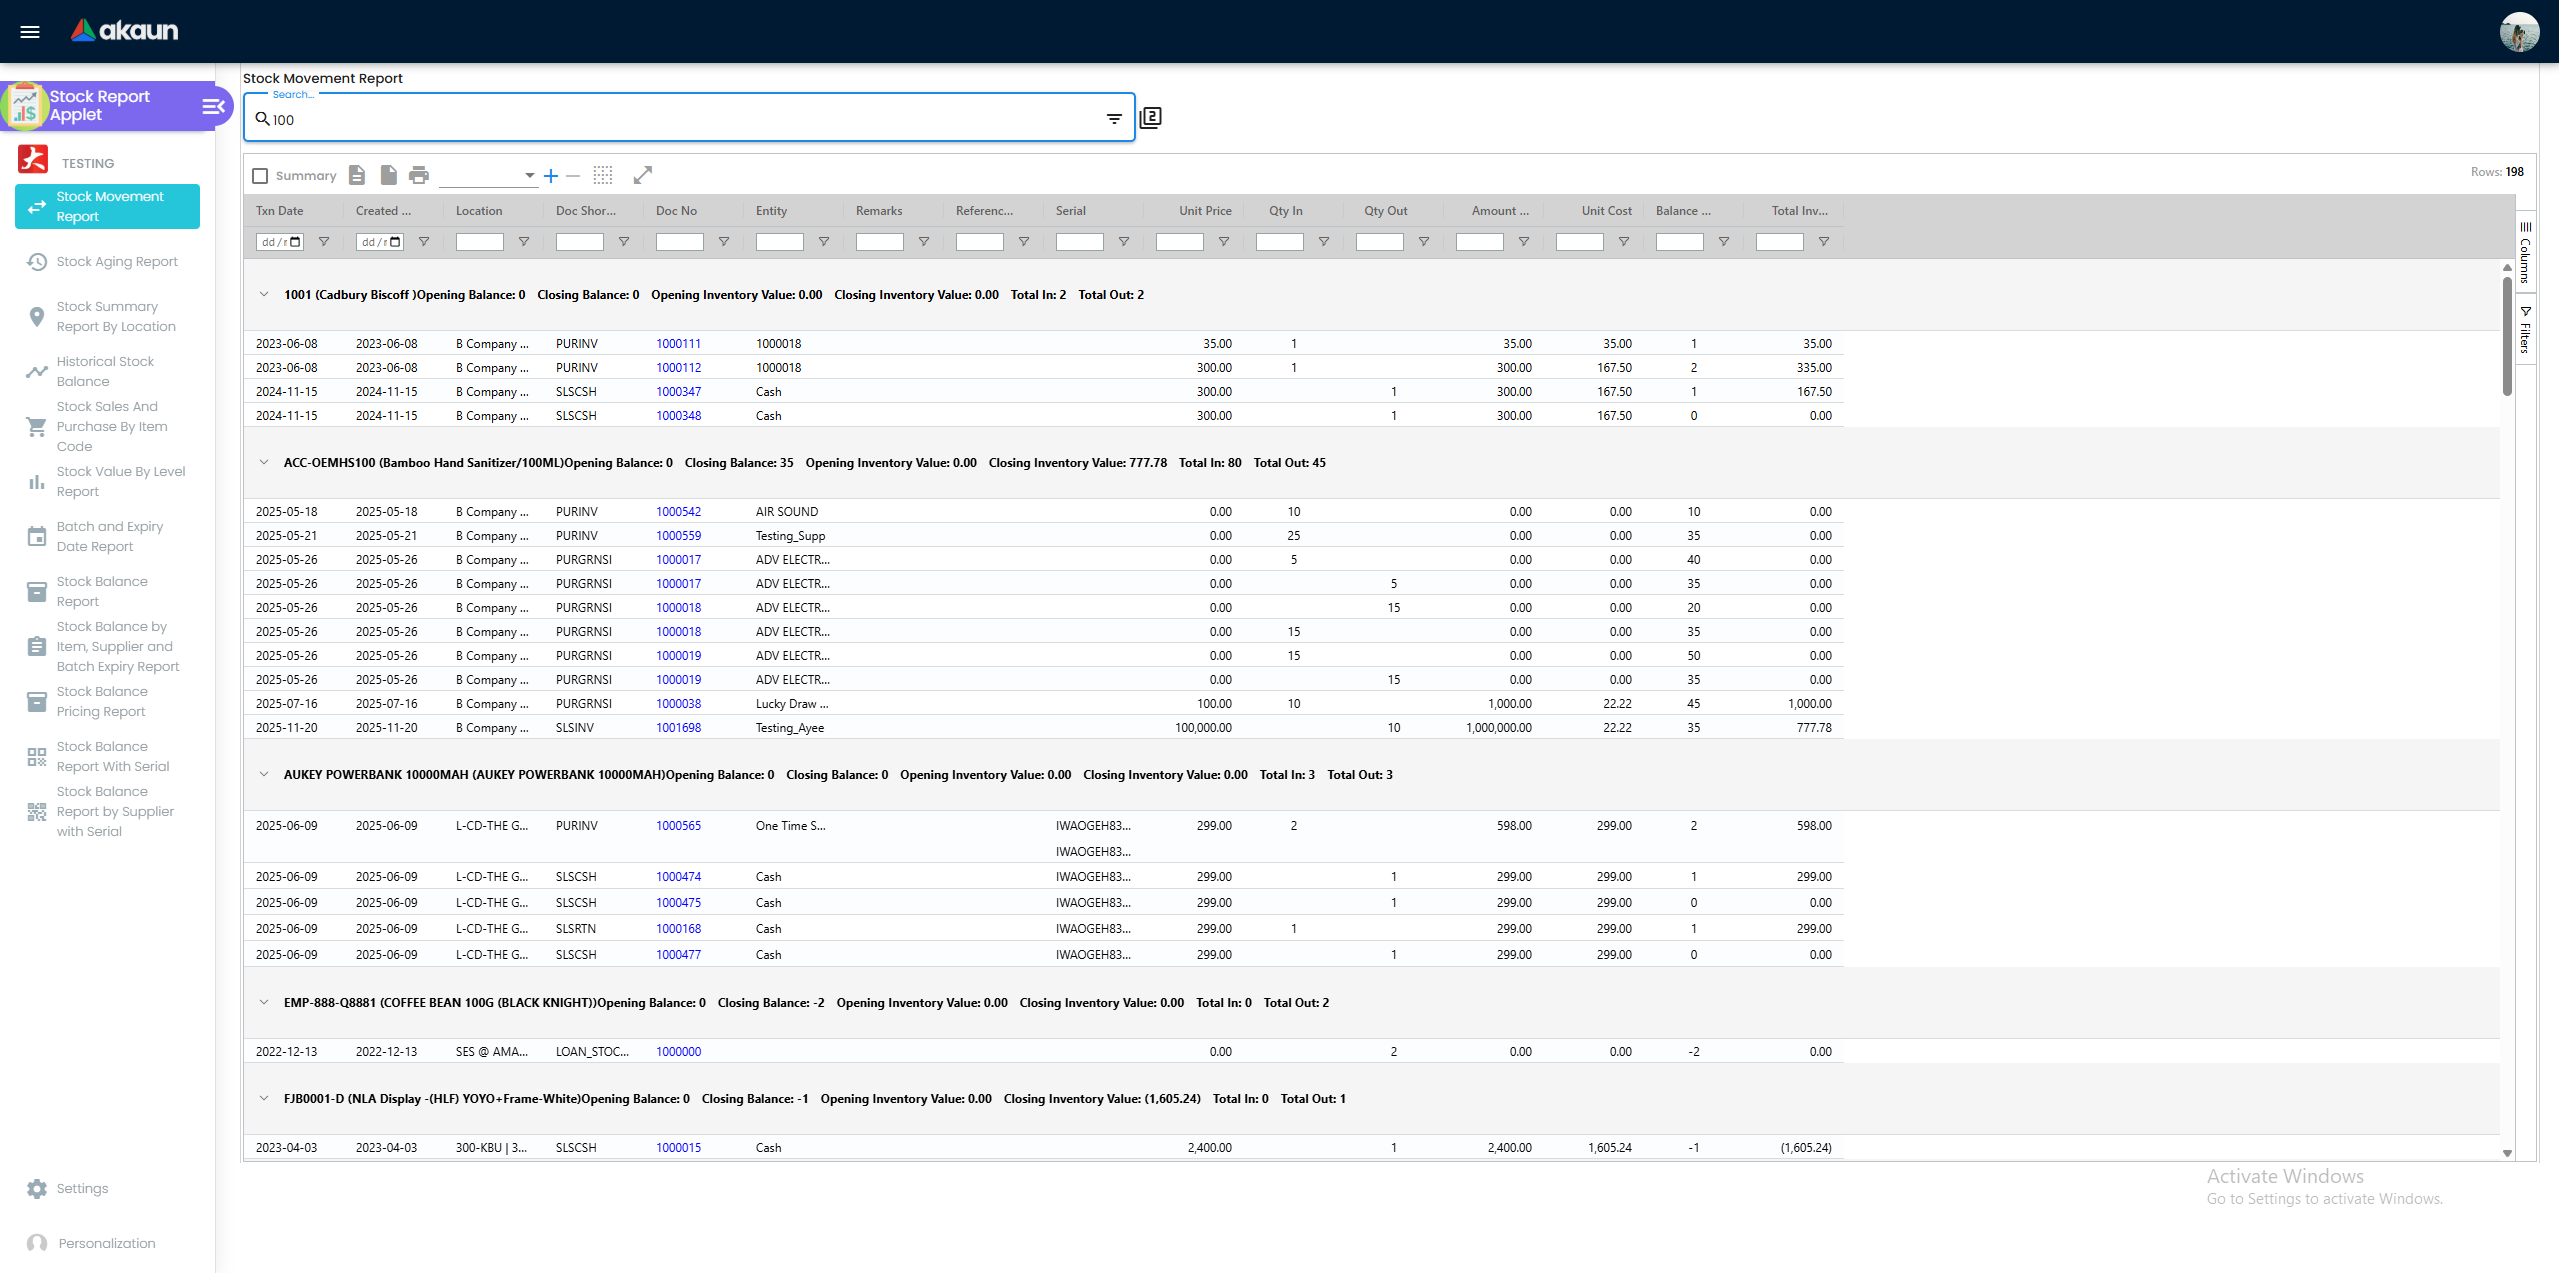
Columns: Txn Date, Created Date, Location, Doc Short Code, Doc No, Ref No, Entity, Ext Invoice Date, Serial, Remarks, Unit Price, Unit Cost, Qty In, Qty Out, Balance Qty, Amount (std / disc / net / tax / txn) and Total Inventory Value. For stock transfers the report shows both locations of the pair. The source is the stock ledger, so a serial number changed by a serial adjustment appears as its own SN_ADJ row (included with Include SN Adjustment), and voided documents can be dropped with Hide Voided Documents (posting_status = VOID). Doc Short Code is blank for any document type that has no short code, and the Sales GIN Stock Out is one of them. To pick those rows out, use the Server Doc Type filter in Advanced Search instead. It lists the raw type names (a Sales GIN Stock Out is INTERNAL_SALES_GIN_STOCK_OUT) and its search box matches any part of the name.
Stock Aging Report
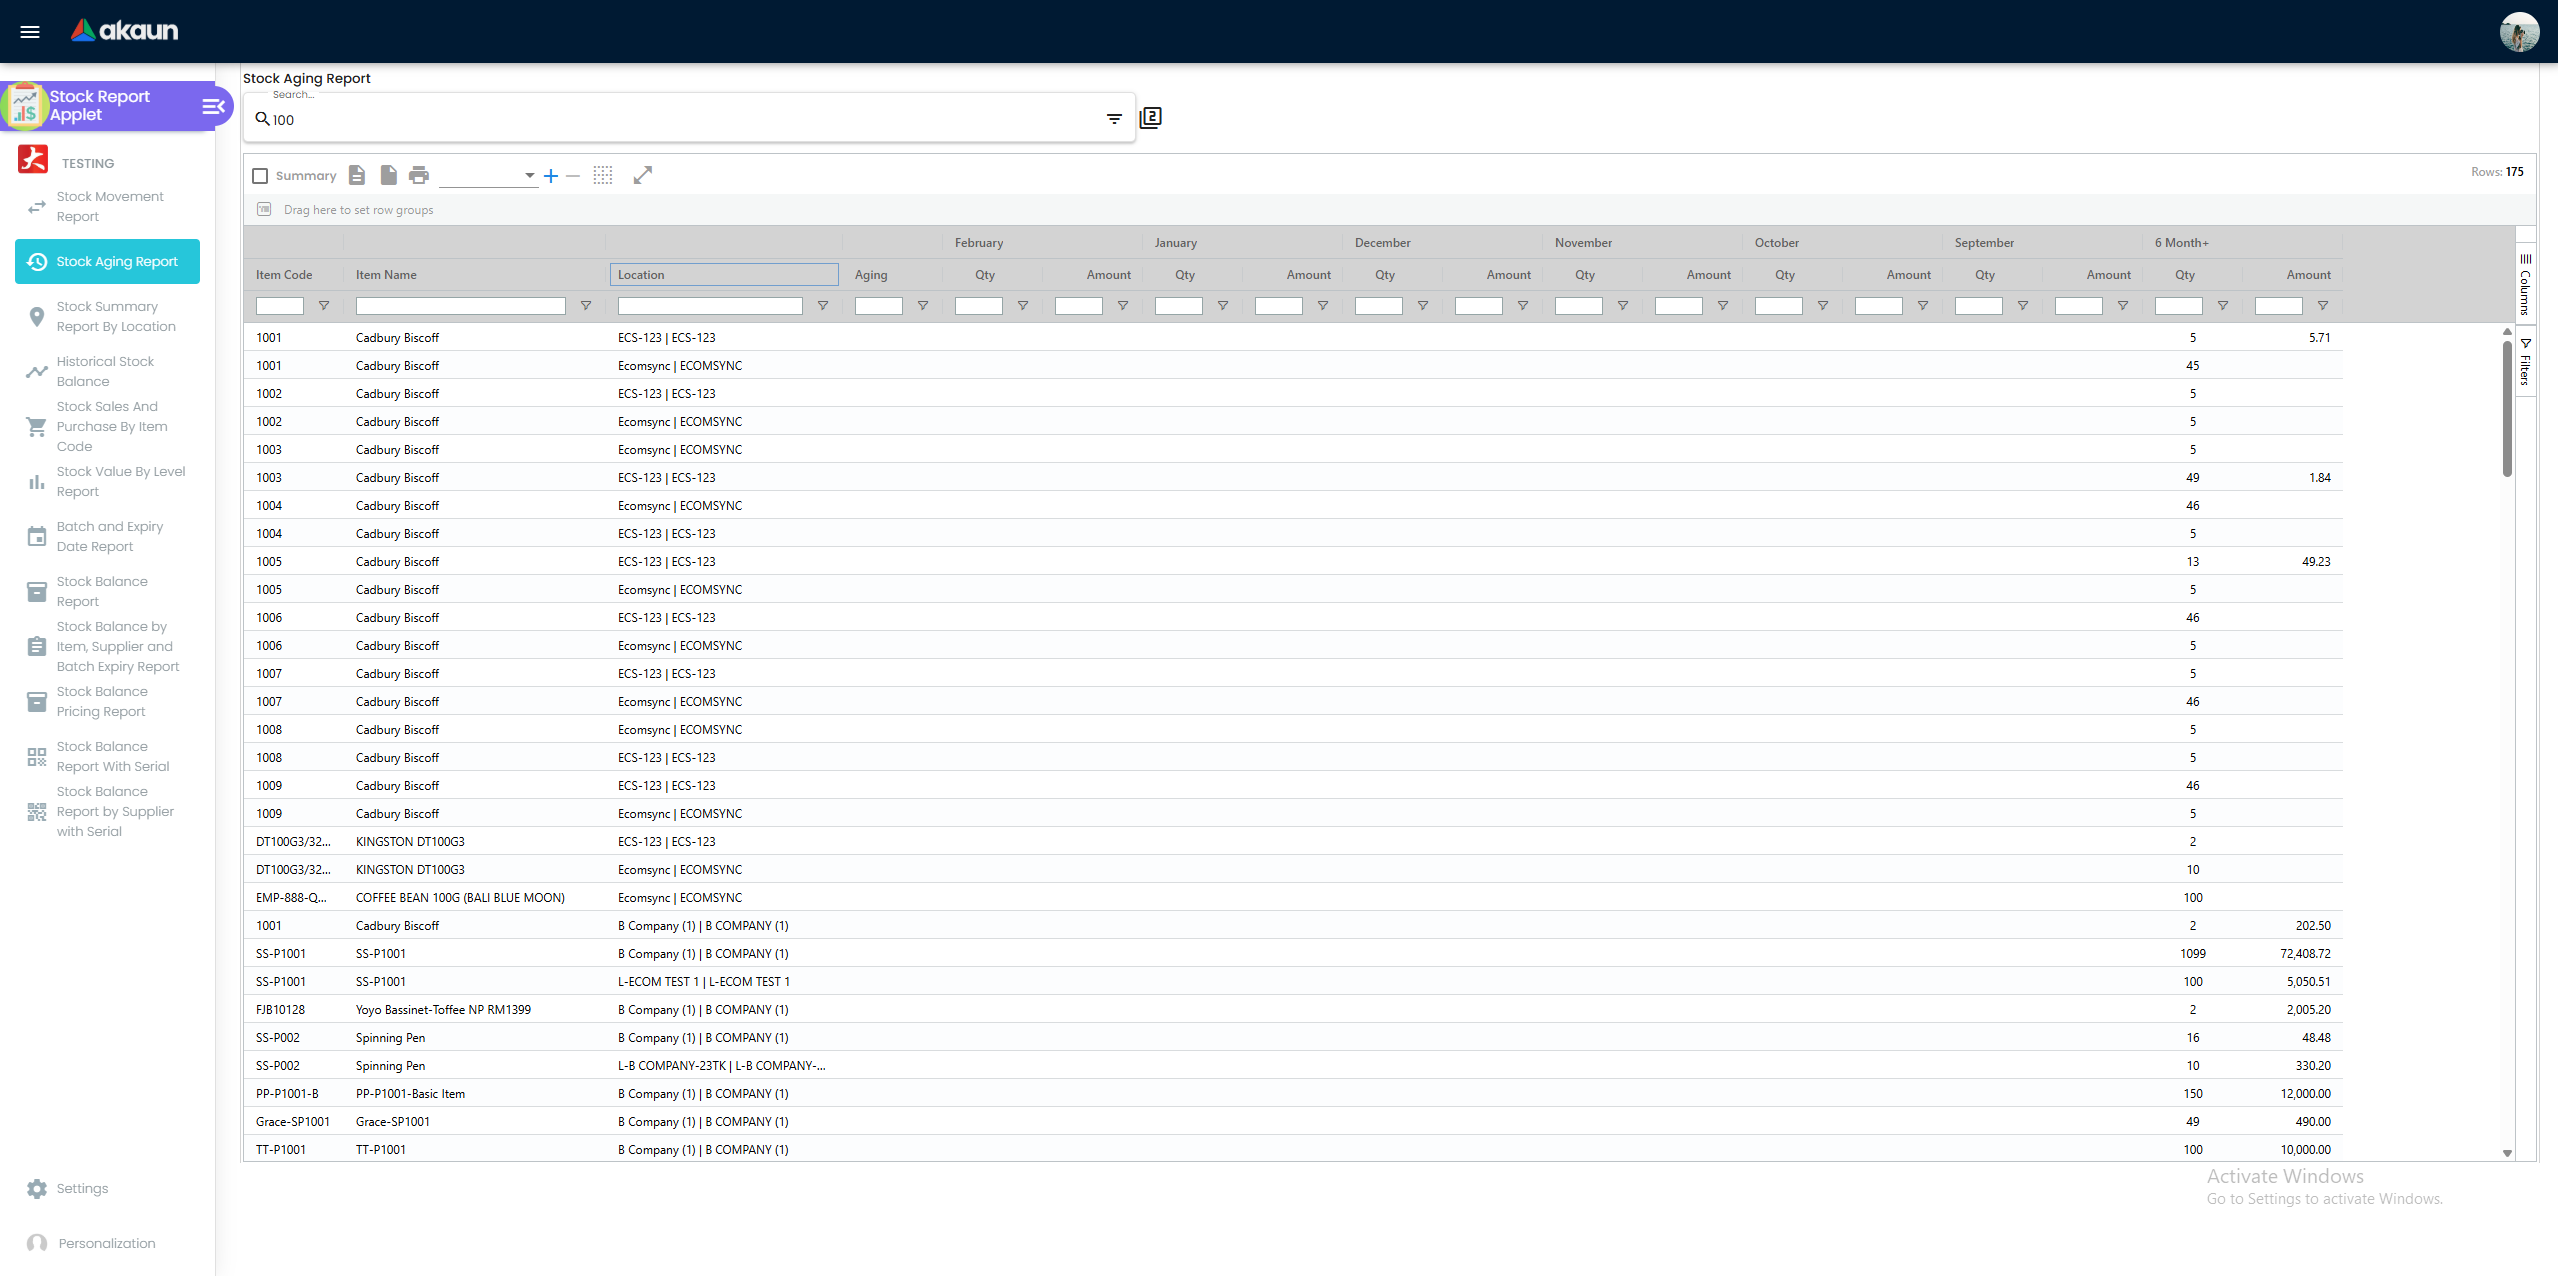
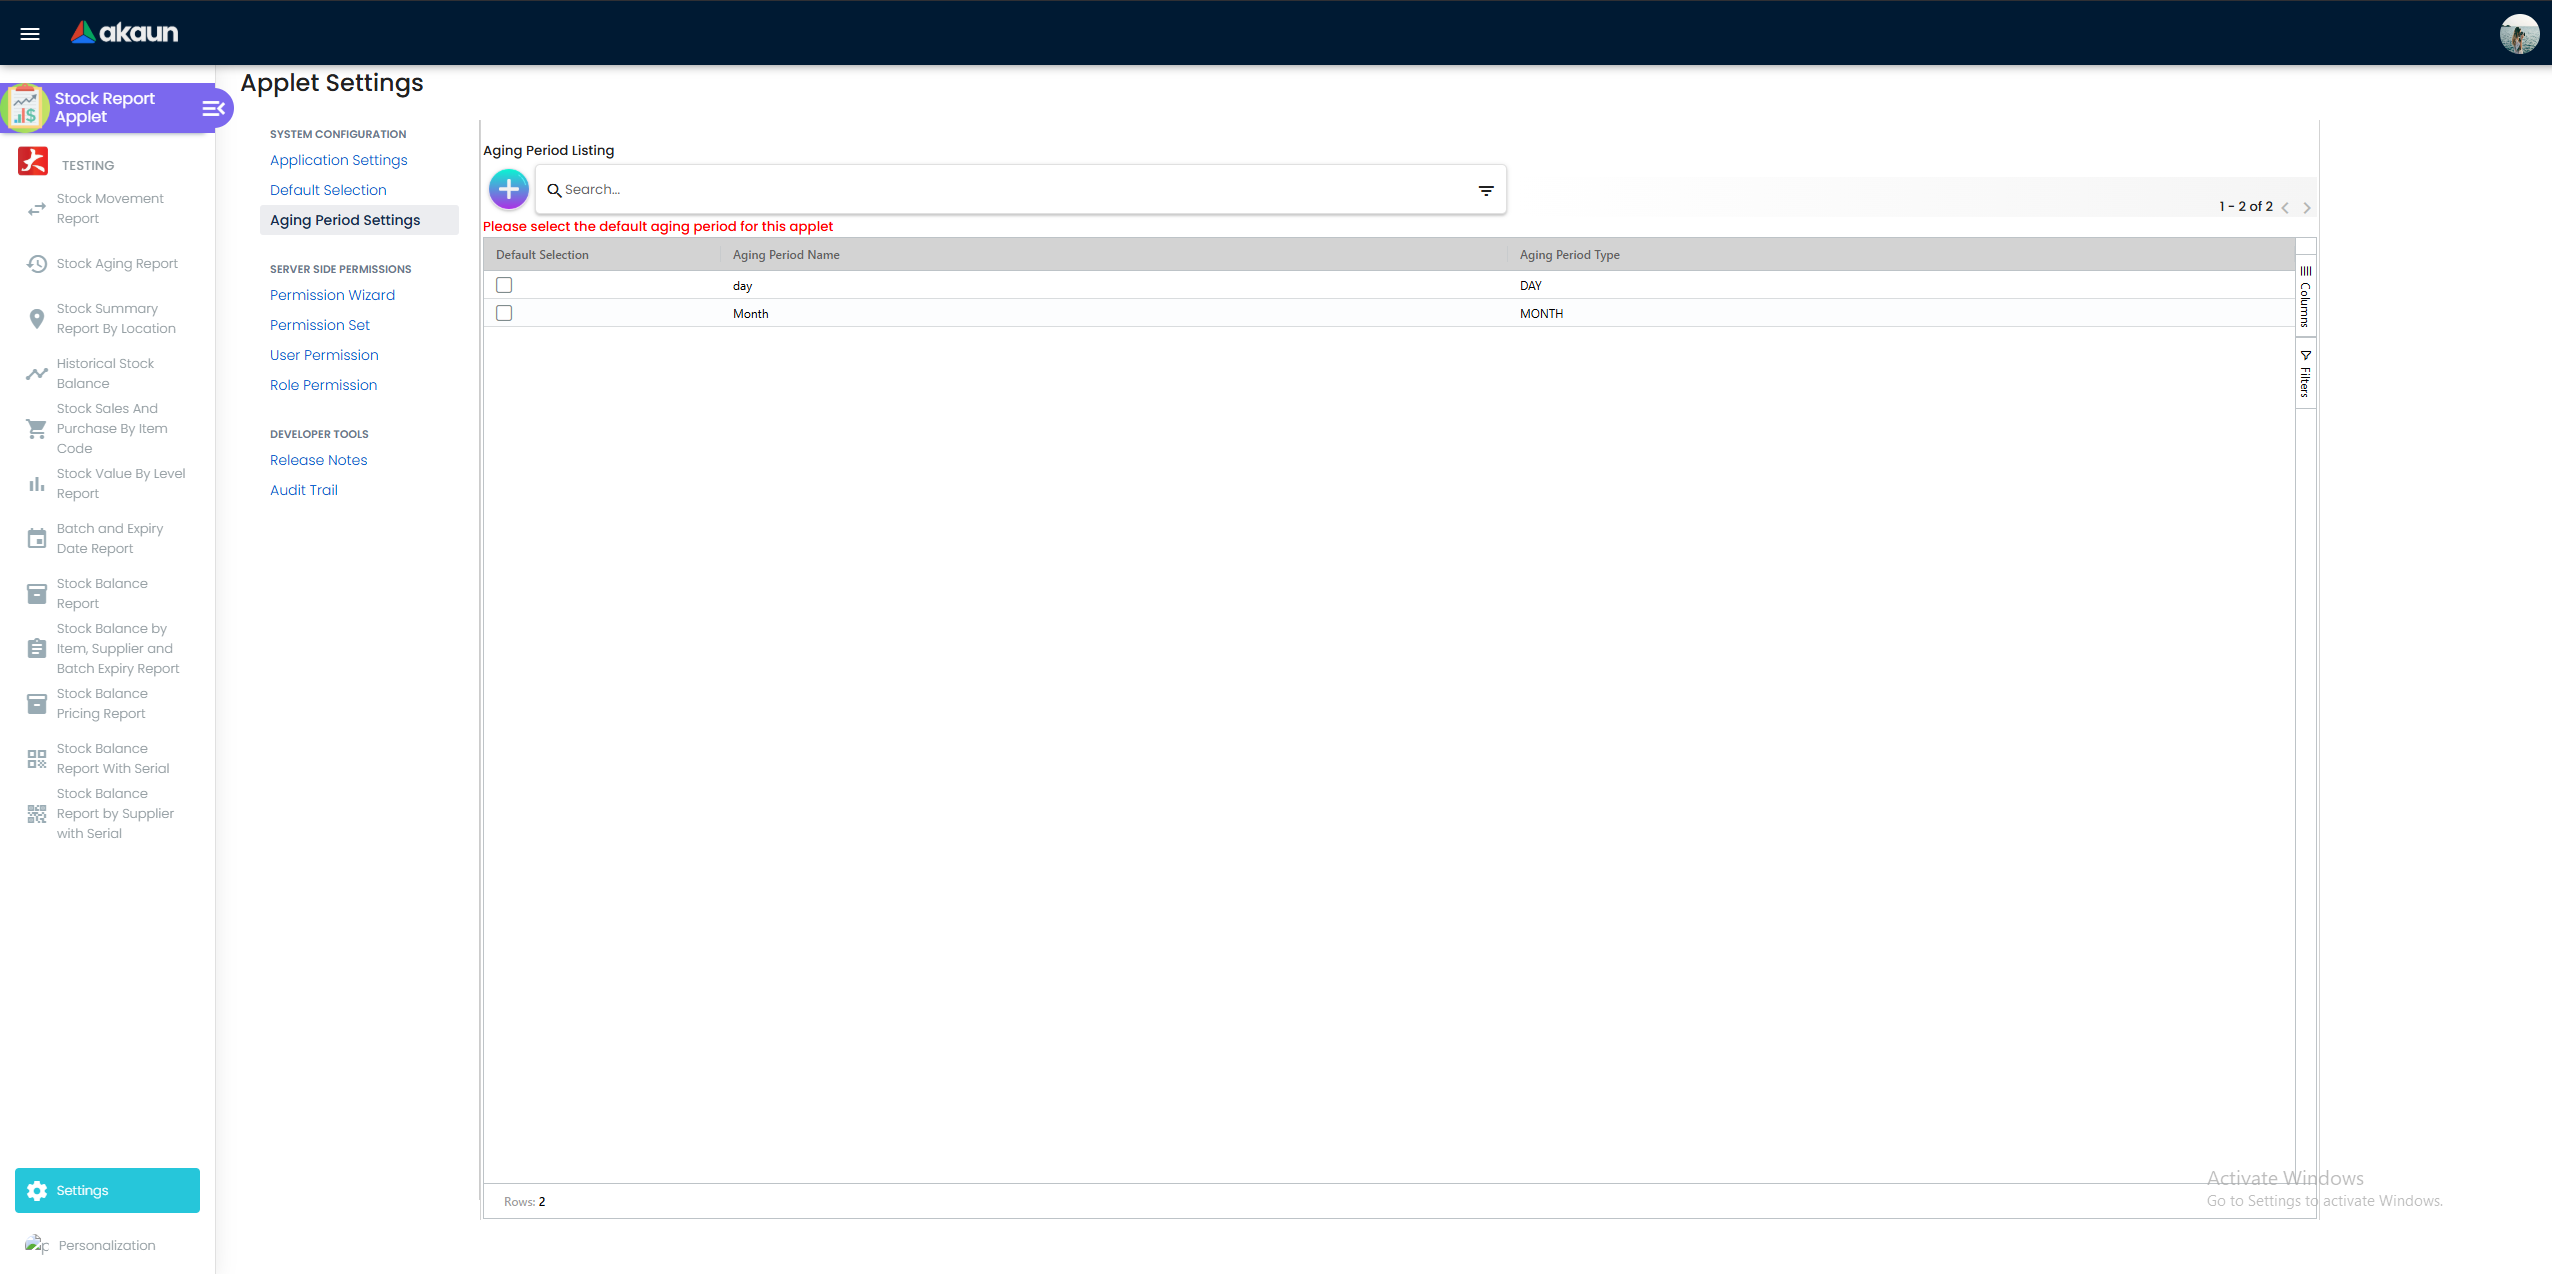
Columns: Company, Location, Item, Inventory Item Code, EAN, Type, Sub Type, UOM, Aging, Qty, Amount, plus one bucket column per period. The report always starts on 1 January 2022, whatever the search panel says: the request is sent with that fixed start and the server replays receipts first-in, first-out from there up to the Date As you choose. Stock received before 2022 that is still on hand is therefore aged as if it arrived with the first movement the replay sees, so treat the oldest bucket as “2022 or earlier”, not as an exact age. The columns are counted back from today, even when Date As is in the past. In month mode (the default) they are this month, each of the five months before it, and 6 Month+ for anything older. In day mode they are the day ranges of the aging-period definition selected under Settings > Aging Period Settings — the setting alone does not create day ranges; selecting a definition does. Every movement that adds stock starts a new age, and a stock transfer counts as one at the receiving location and, through the company’s in-transit location, at company level too. So transferred and returned stock always looks new, whether you run the report for a location or for the company. To find stock with no sale in a period, the Sold column of the Stock Summary Report By Location over that period is the better tool, because transfers fall under Others.
Stock Summary Report By Location
Screenshot withdrawn; a recapture from a demo tenant is on the list.
Per item and location: Open Balance, Purchase, Sold, Adj, Others, Stock In Transit, Last Purchase Date, Closing Balance, Closing Balance (include non-movement) and Closing Inventory Value. The backend classifies ledger lines by document type: Purchase = purchase invoice, purchase GRN (stock-in), purchase return; Sold = sales invoice, cash bill, sales return; Adj = stock adjustment; Others = everything else (transfers, consignment, RTV, and stock shipped on a Sales GIN Stock Out, so a sale made that way is not in Sold); Stock In Transit = outbound stock transfer queue quantity still open plus draft inbound transfer lines. Closing Balance is the running balance read off the last ledger line up to the end date, the same line Historical Stock Balance reads, so it already includes transfers and every other movement. Closing Balance (include non-movement) rebuilds it as opening plus every movement column; the two differ only when the running balance and the movements disagree (a back-dated document still being re-costed, or a stock-sync line with no document type, which no column counts). Closing Inventory Value is the closing balance times the company price on the company’s last ledger line of any kind before the end date.
Historical Stock Balance
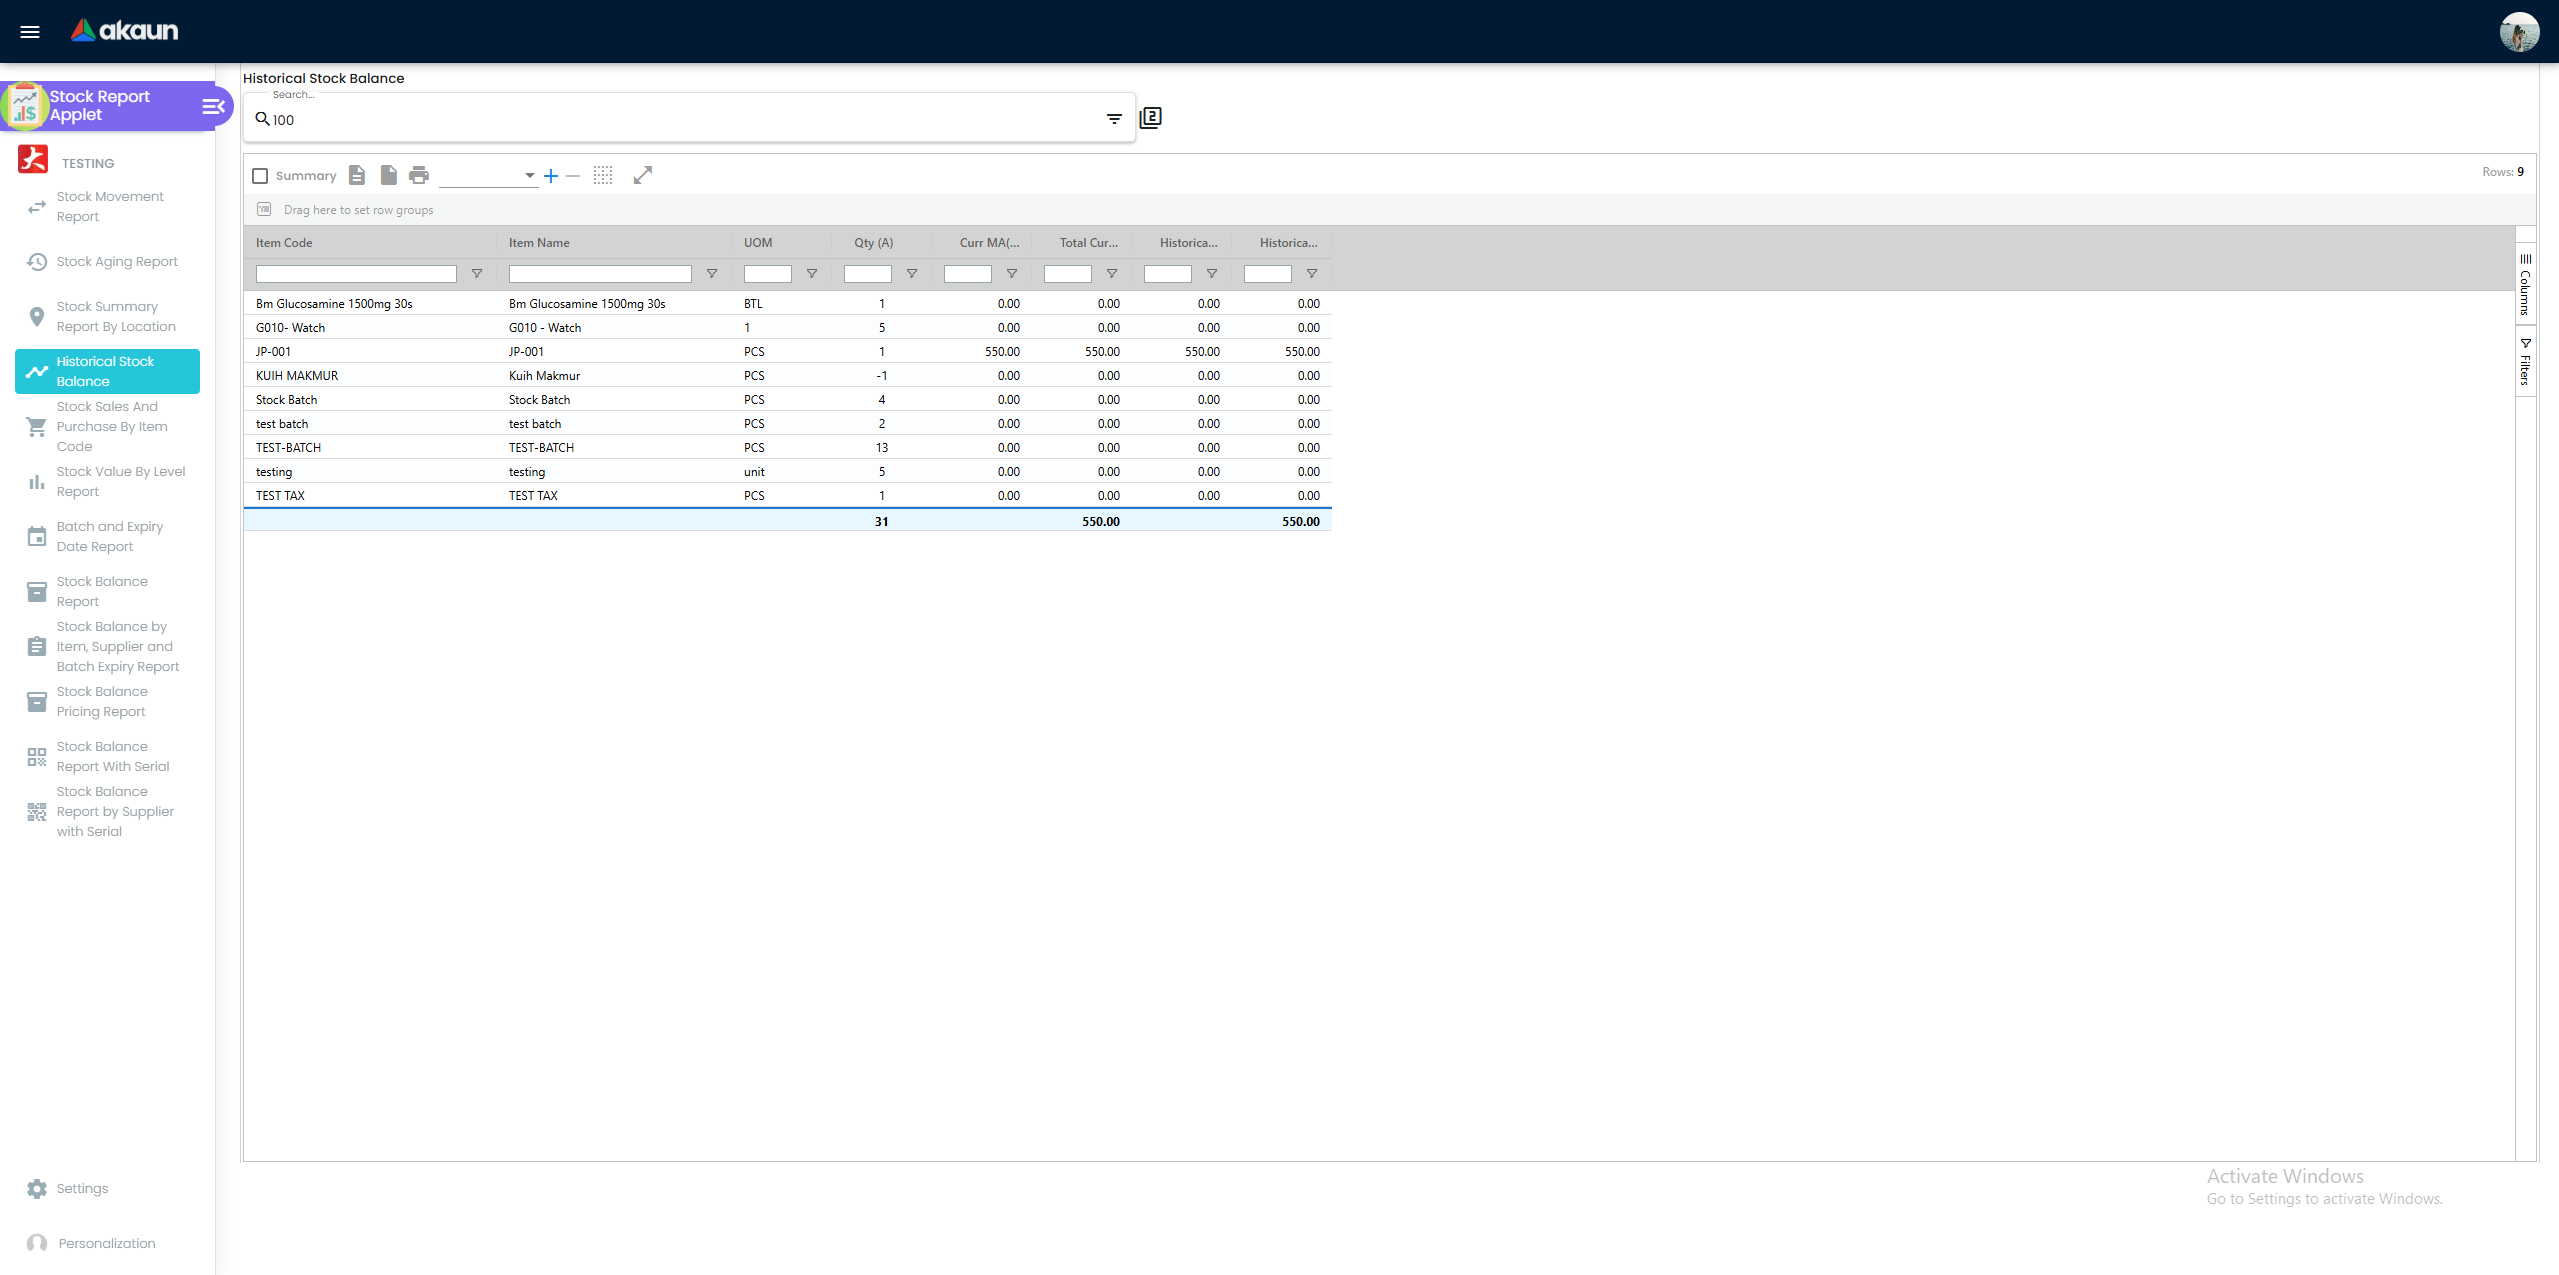
Columns: Item, Type, Sub Type, UOM, Qty (as at date), Historical MA cost and value, Current MA cost and value, Serial Numbers (optional). Quantity is read, not added up. For each item and location the report takes the running balance stored on one ledger line — the latest one dated up to the end of the balance date. When two or more of an item’s lines at a location carry the identical transaction date and time (two lines for the item on one document, or several documents stamped with the same moment), the tie is broken by an internal identifier, not by the order they were posted. That is also the order in which BigLedger builds the running balance when it posts, re-costs a back-dated document or rebuilds the chain, so the line the report picks is the last in that order and carries the balance after every movement of that moment. The figure is right. Two more rules decide what you see: only ordinary document movements and the two stock-sync types are read, so a later line of another type is not; and an item with stock but no costed movement (purchase-and-sales or Reset MA) at that company before the date is left out of the report altogether. The historical MA cost is taken from the last purchase-and-sales or Reset MA ledger line before that date. To check a figure you doubt, open the item on the Stock Movement Report for that location. It lists the lines in the same order, so the lines that share a moment sit together and the balance after the last of them is the one that counts. Created Date does not tell you which came last: within one moment the order is the internal one, so the balances of the lines in between can look out of sequence, and one can even be negative, while the figure after the last line is right. Stock Summary Report By Location is not an independent check here, because its opening and closing quantities are read off a ledger line the same way. Trade-in stock is not included (open request).
Stock Sales And Purchase By Item Code
Screenshot withdrawn; a recapture from a demo tenant is on the list.
Columns: Item, Description, Location, Balance Qty, Purchase Qty / Amount, Qty Sold, Sales Amount, Cost, GP, Last Purchase, Stock Turn Ratio. Purchases are purchase invoice, GRN (stock-in) and purchase return lines; sales are sales invoice, cash bill and sales return lines, within the date range. GP = Sales Amount − Cost; the GP columns are gated (see Configuration).
Stock Value By Level Report
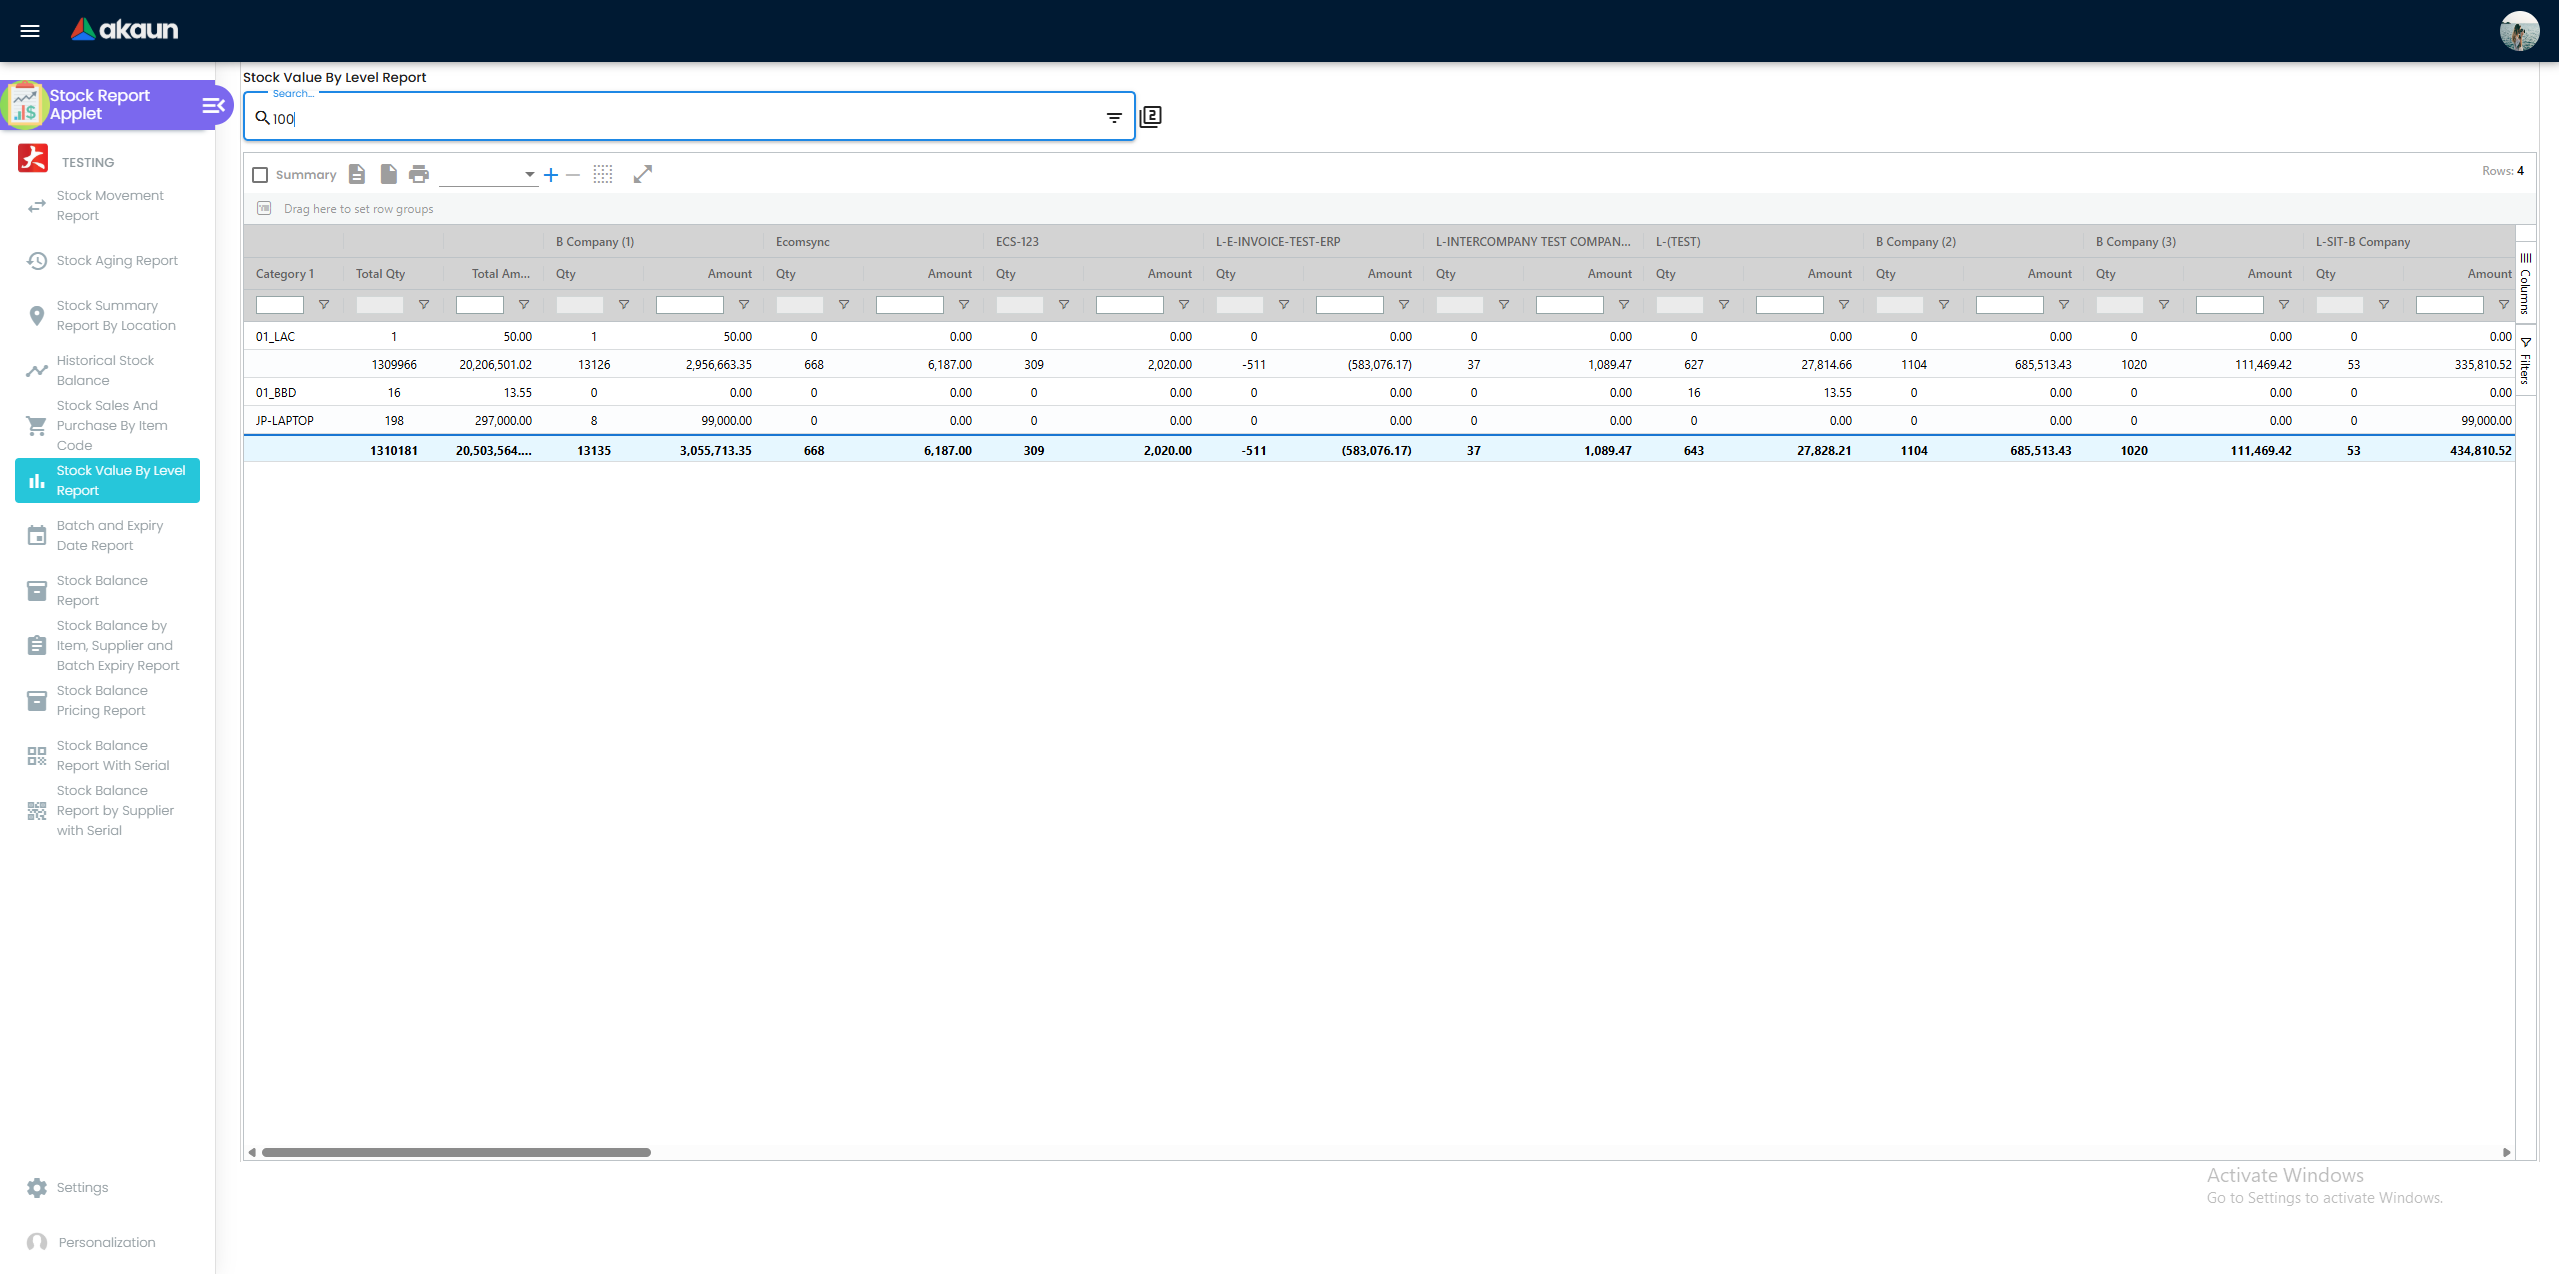
Groups stock by category levels 1–10 (level 0 is also supported) with a Qty and Amount pair per location and totals. It reads the stored balance rows, so it shows now and has no date. Its Amount is not a location’s value: each location row carries the company’s whole value of the item, and the totals add it once per location that holds a balance row for the item (a known issue, reported to engineering). Take stock value from Historical Stock Balance.
Batch and Expiry Date Report
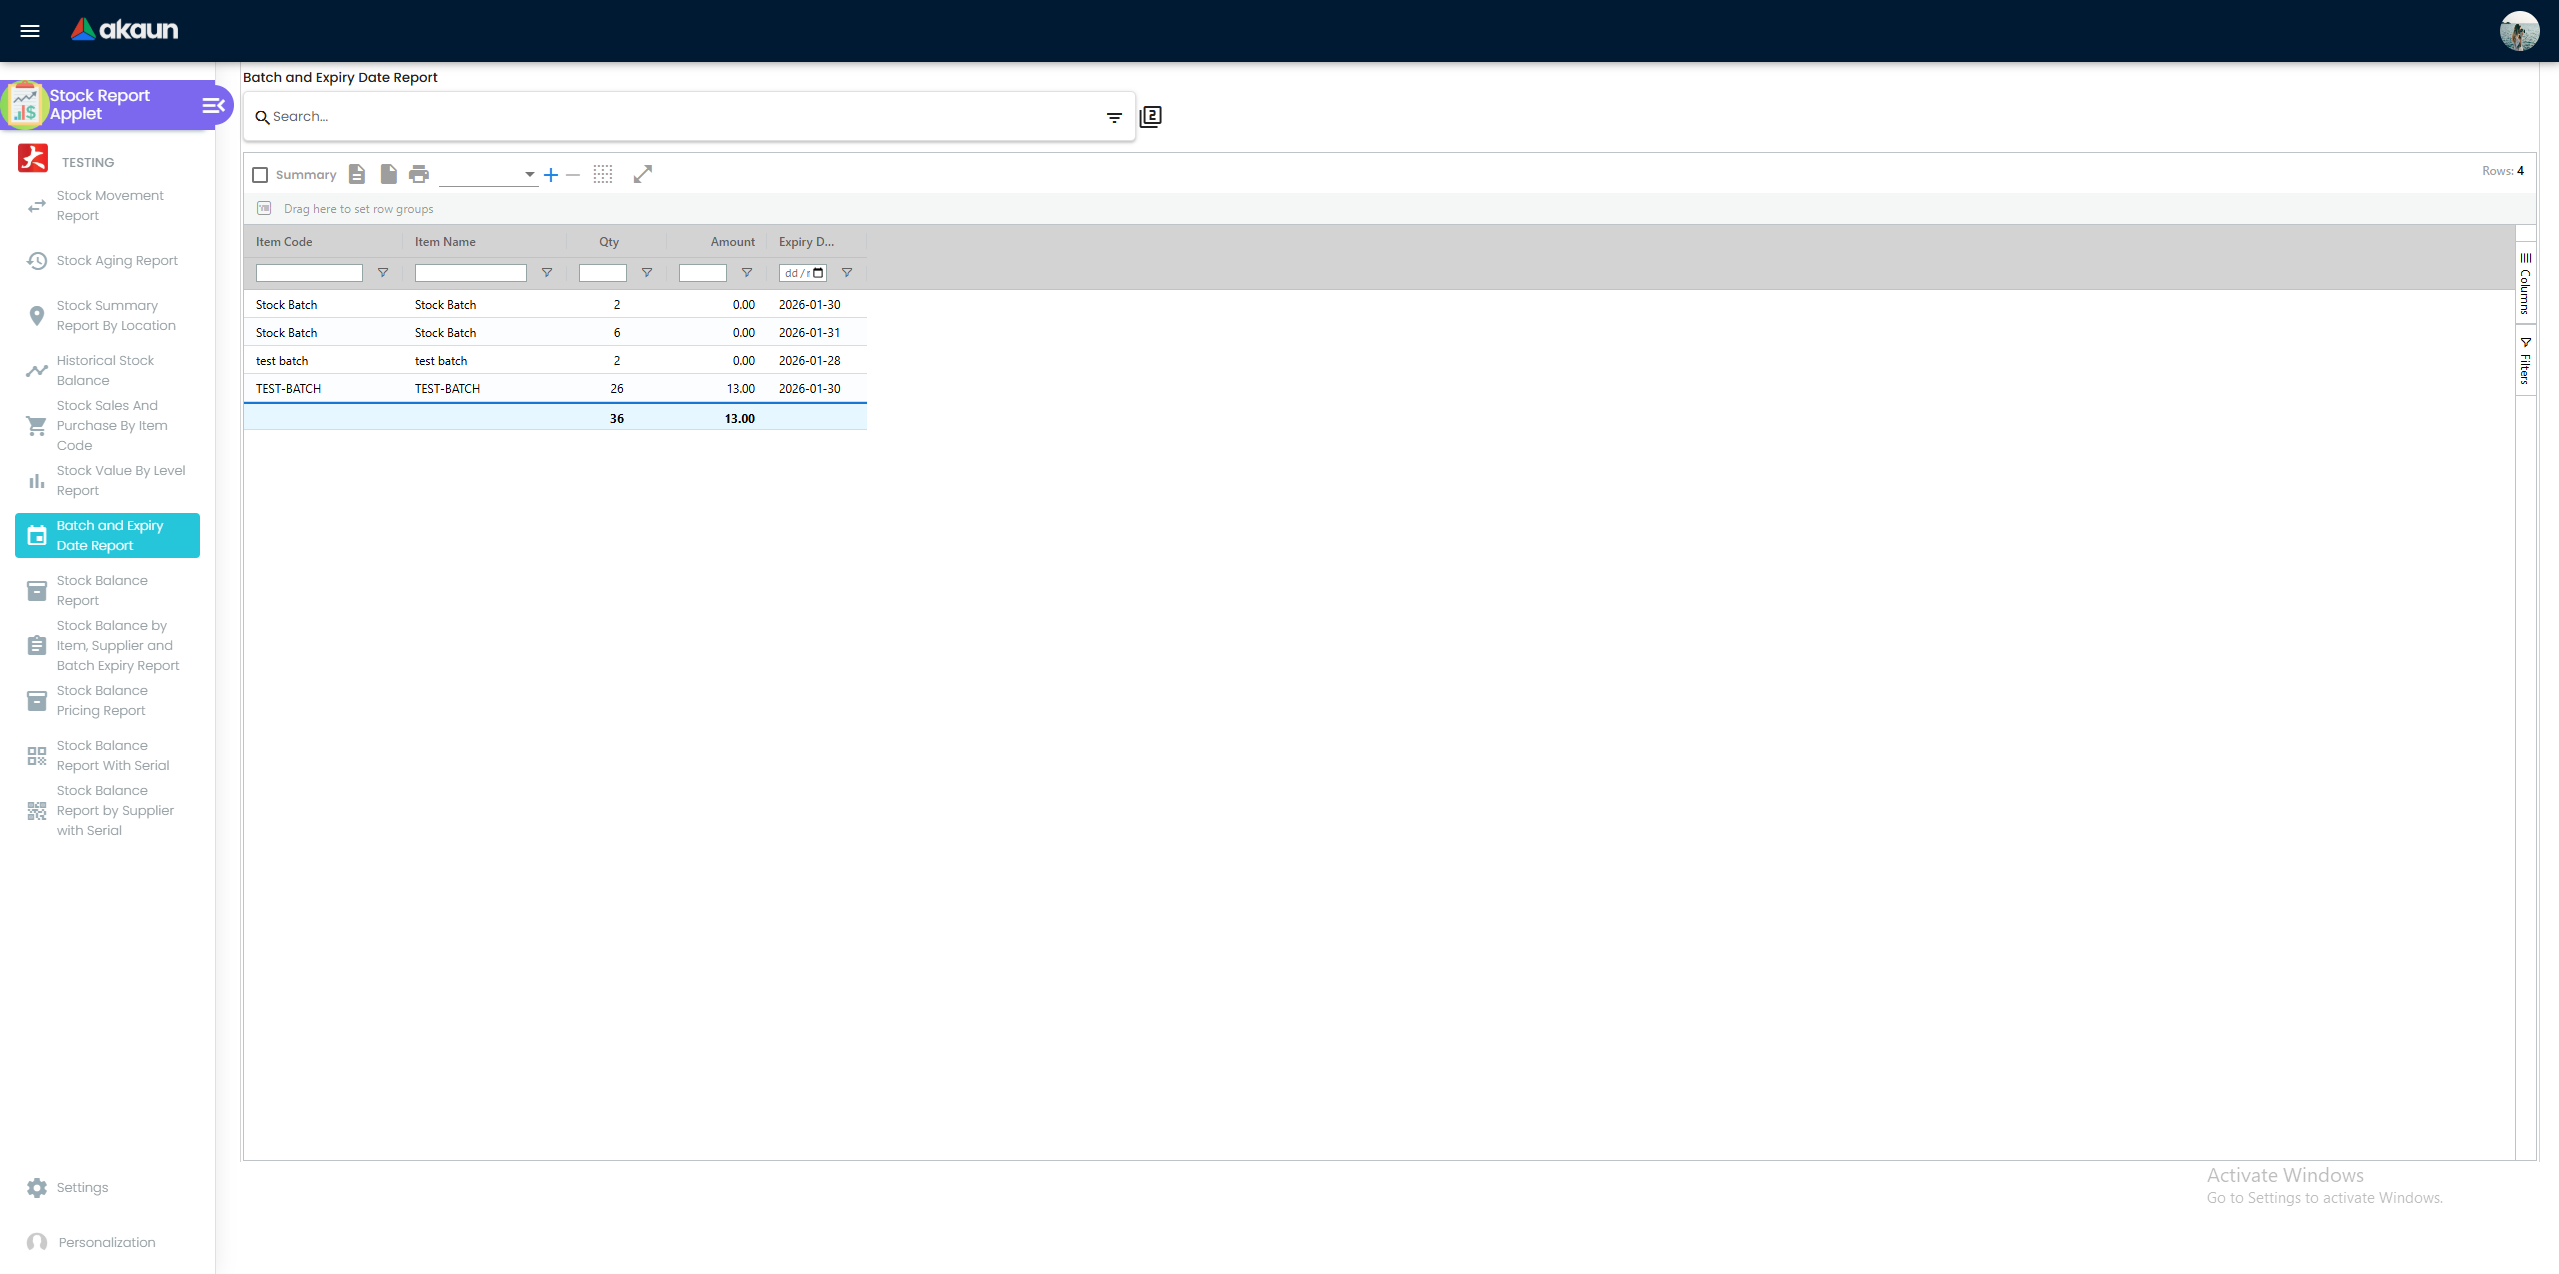
Columns: Item, Expiry Date, Qty, Amount and buckets 0 Month, 1 Month, 2 Months, 3 Months, 4–6 Months, 7–12 Months, 13–24 Months, >24 Months, relative to today.
Stock Balance Report
Screenshot withdrawn; a recapture from a demo tenant is on the list.
Columns: Company, Item, Type, Sub Type, UOM, Balance Qty, Unit Cost (MA), Total Cost, Unit Last Cost, Total Last Cost, category levels. Show Zero Balance includes items with no stock.
Stock Balance Pricing Report
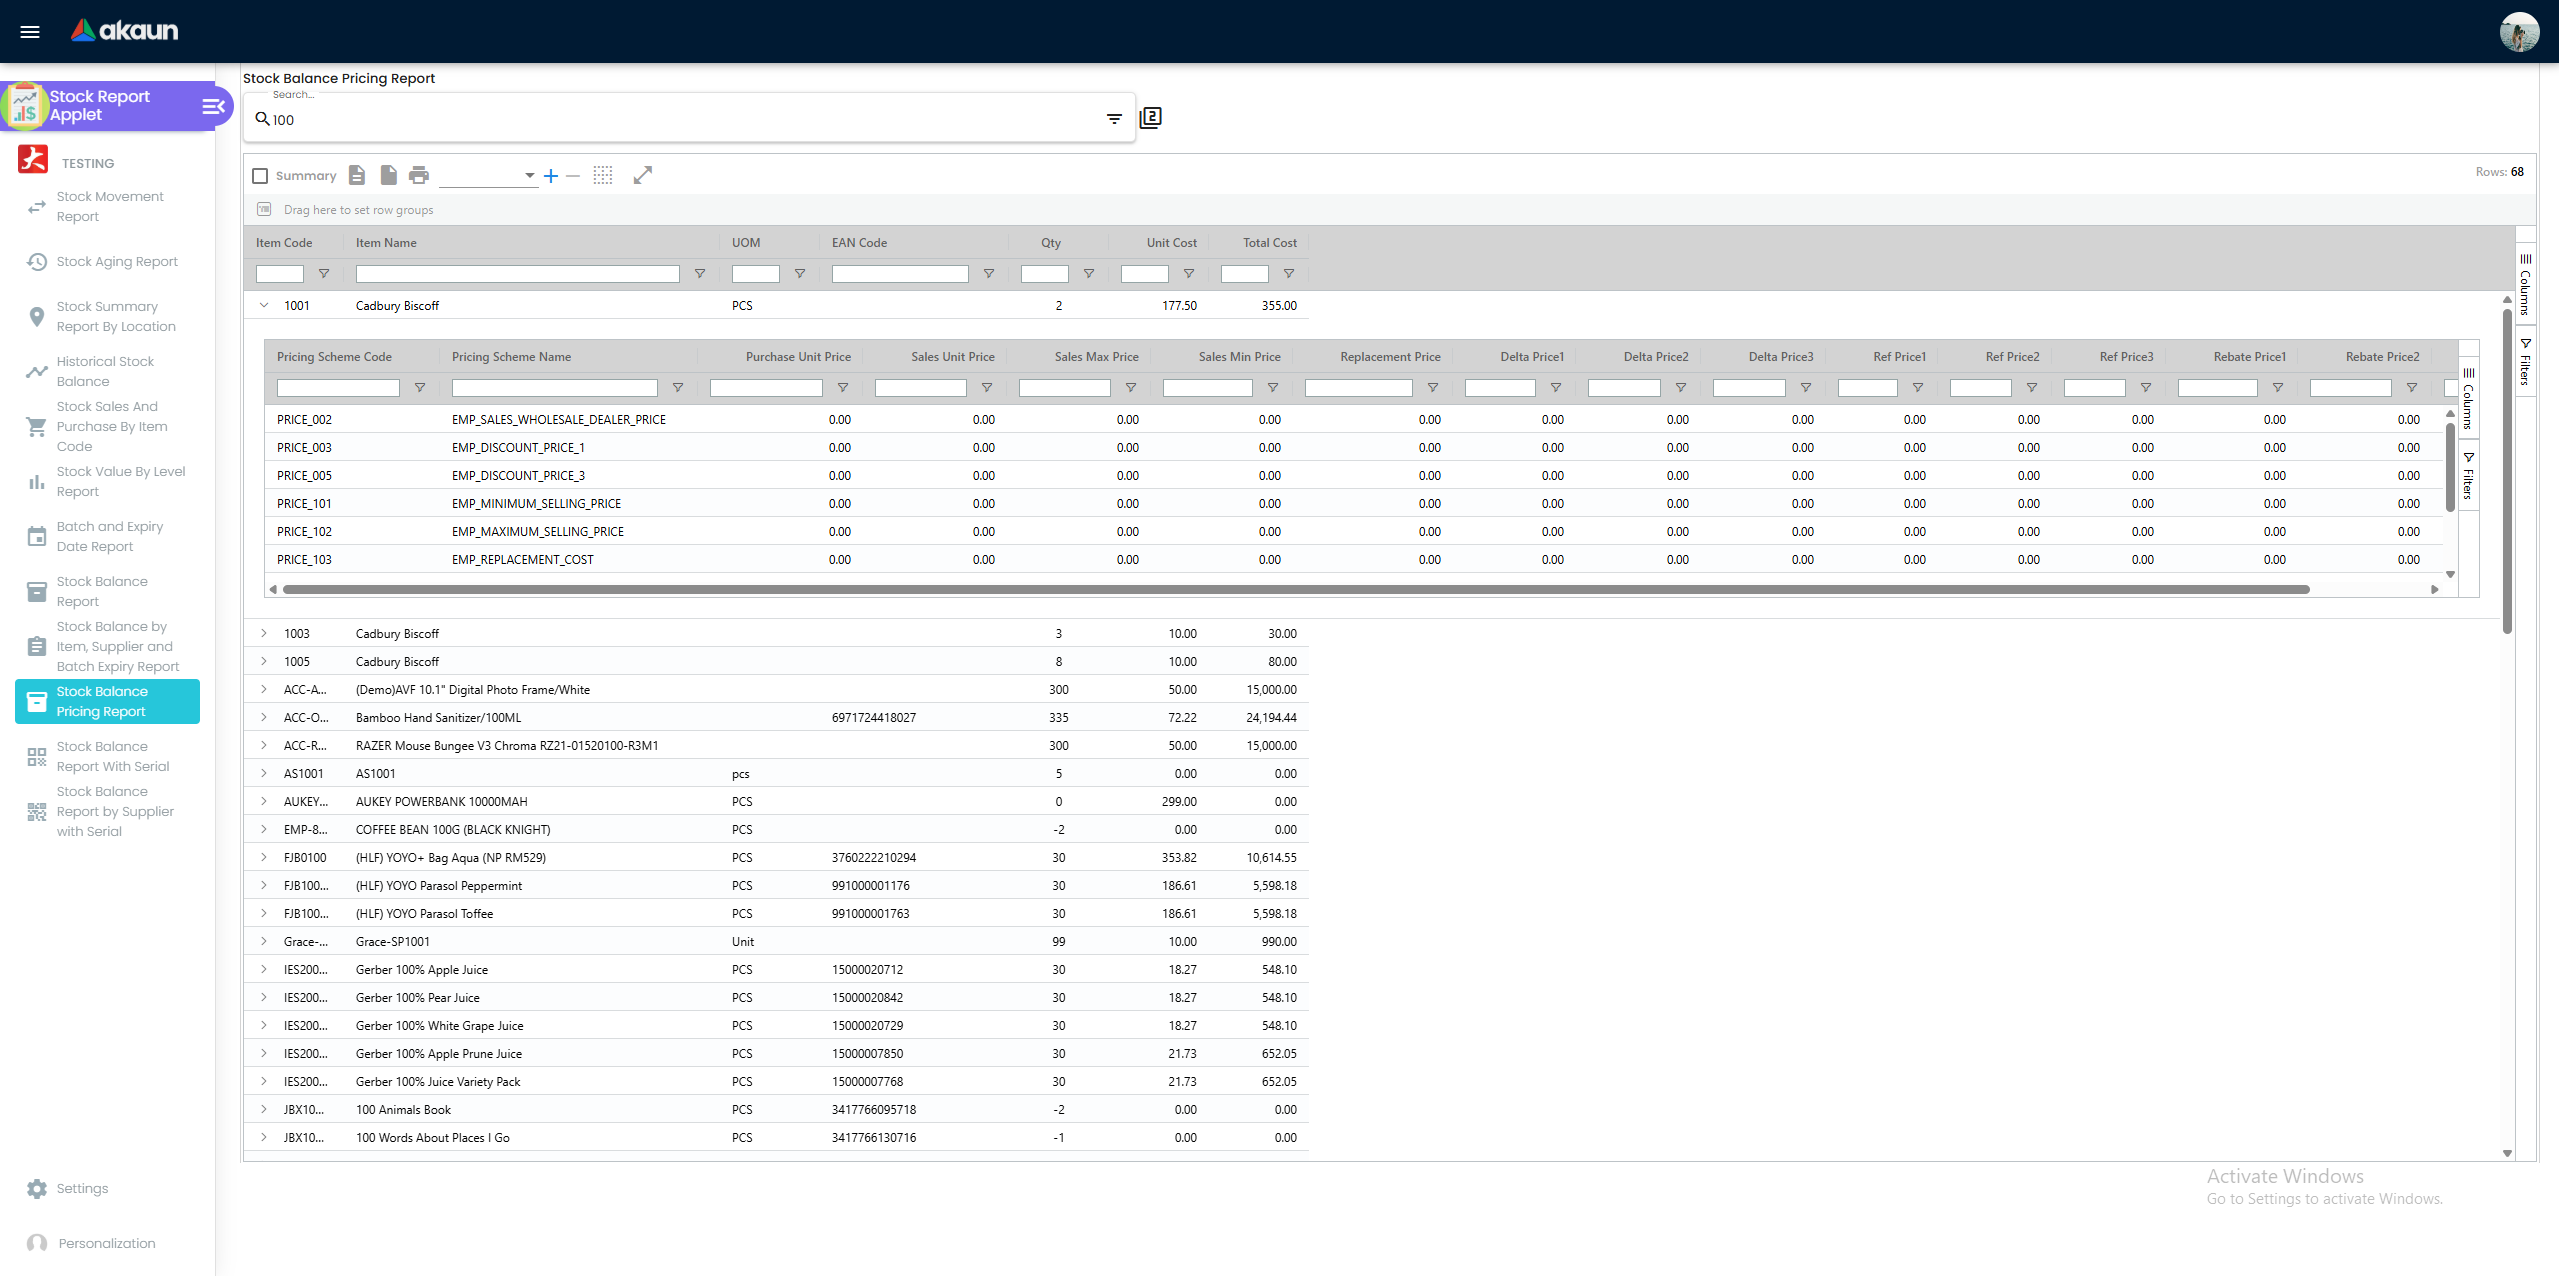
Adds the item’s Pricing Scheme, Sales / Purchase Unit Price, Sales Min / Max, Ref Price 1–3, Delta Price 1–3, Rebate Price 1–3, Replacement Price, Input / Output tax code, rate and type, and Unit / Total Cost. Which pricing schemes are included is set by PRICING_SCHEMES in Application Settings. Once the report is open, its column header reads Stock Summary Report By Location, the same title as a different report on the menu; go by the menu entry.
This is the one screen that can list every item that has gone negative. Its Advanced Search has an Option Balance filter: POSITIVE, ZERO or NEGATIVE, or blank for all. Set to NEGATIVE, the report keeps only the location balances below zero, so an item with none does not appear at all. That makes it the daily check for selling ahead of receiving. The Stock Balance screen cannot do this, because it never shows a zero or negative balance. The Stock Balance Report above shows a negative only when the whole company is negative, and a branch that is short can hide inside a positive company total.
Two things to know when you read the result. Each row is an item, not an item at a location. Qty adds together the negative balances of every location you picked, and there is no location column. To learn where the shortfall is, pick one location per run. It is the balance now, not at a past date, so run it at close of day. Then open the item on the Stock Movement Report for that location to find the document that overshot. If the report is missing from your sidebar, HIDE_STOCK_BALANCE_REPORT_MENU is on (see Applet settings).
Stock Balance Report With Serial, by Supplier with Serial, and by Item / Supplier / Batch
Screenshot withdrawn; a recapture from a demo tenant is on the list.
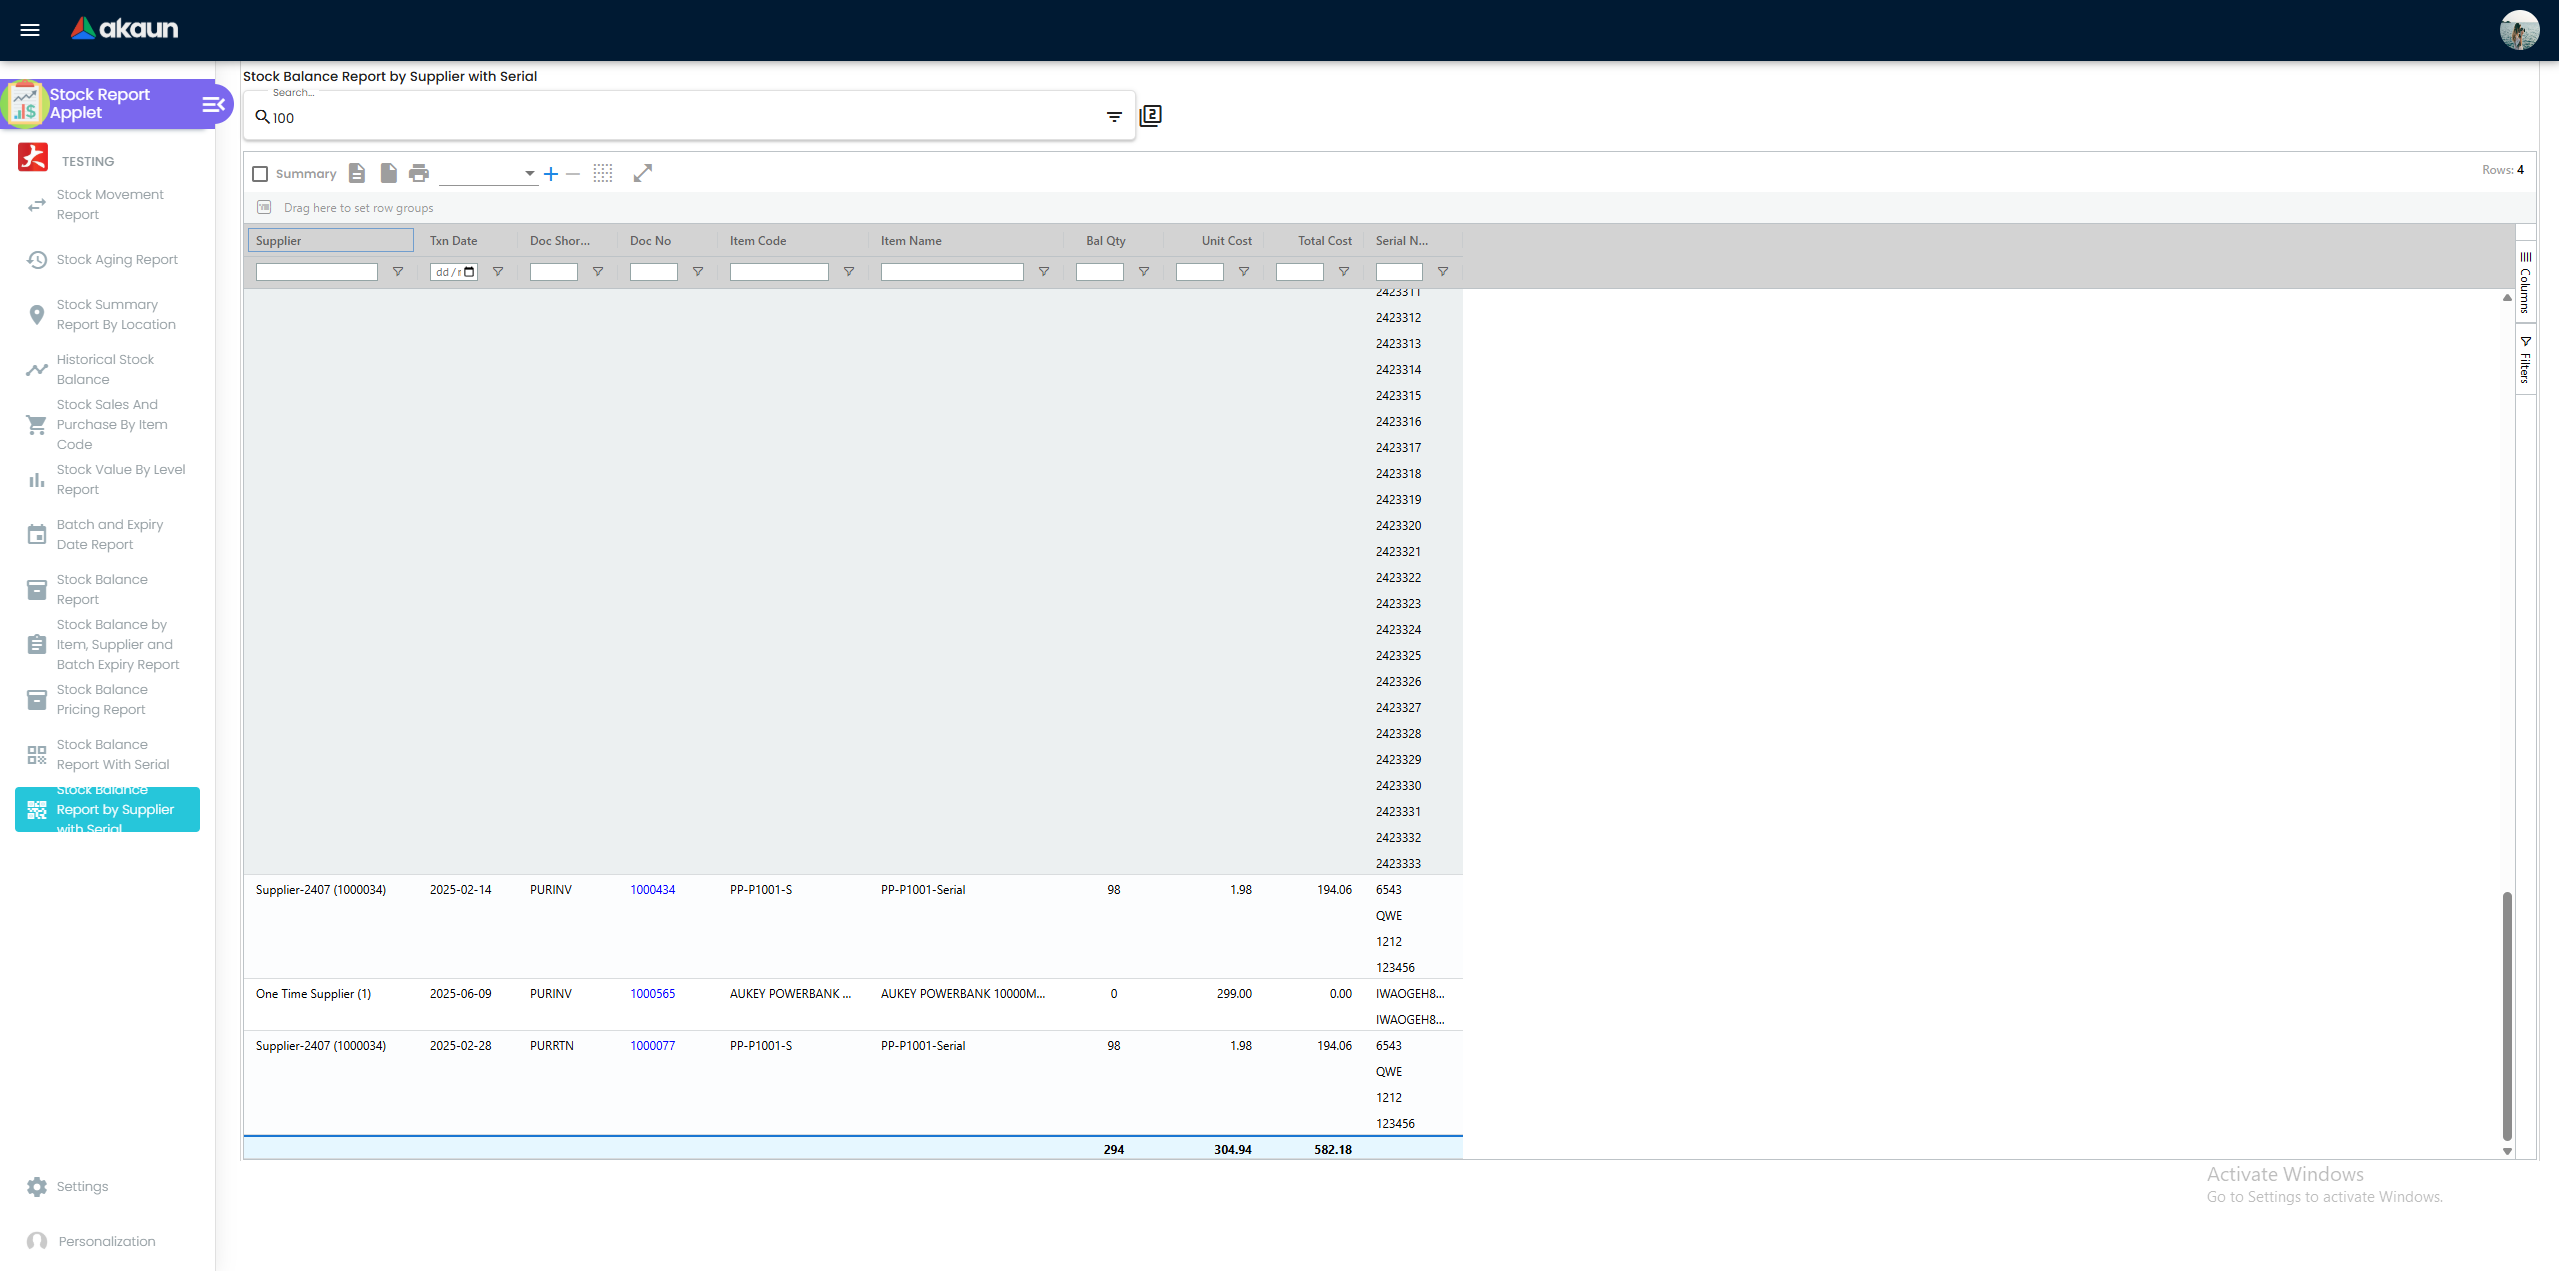
With Serial: Location, Item, EAN, UOM, Qty, Serial Numbers, Add, Subtract, Stock Count — a count sheet with serials. By Supplier with Serial: Doc Short Code, Doc No, Txn Date, Supplier, Item, Serial Numbers, Balance Qty, Unit / Total Cost — one row per finalised purchase invoice or purchase return line, with the serials on that purchase. Balance Qty and the costs are the company’s current balance of the item, repeated on every purchase row, so do not total them; it tells you who supplied an item and on which document, not what is left of each purchase. By Item, Supplier and Batch Expiry: Entity, Item, Batch Number, Qty, MA Price, MA Amount.
Configuration
Before you can use it
| Prerequisite | Where | Why |
|---|---|---|
| Report read permissions | Applet permission assignment | Each report calls its own API permission (API_TNT_DM_ERP_STOCK_REPORT_READ, …STOCK_AGING_REPORT_READ, …STOCK_SUMMARY_REPORT_BY_LOCATION_READ, …STOCK_SALES_PURCHASE_BY_ITEM_CODE_READ, …STOCK_VALUE_BY_LEVEL_READ, …BATCH_AND_EXPIRY_DATE_READ, …STOCK_BALANCE_REPORT_READ, …STOCK_BALANCE_REPORT_BY_BATCH_NUMBER_READ, …STOCK_BALANCE_WITH_SERIAL_NUMBERS_READ), targetable to locations and branches. Historical Stock Balance has no family of its own: it uses the plain API_TNT_DM_ERP_STOCK_REPORT_* family, the same as the Movement report. The hidden Item Price Change route calls API_TNT_DM_ERP_ITEM_PRICE_CHANGE_* |
| Location read permissions | Applet permission assignment | Non-administrators see only locations they may read. On the Movement report, a user with no location picked and no location-scoped permission falls back to their Default Selection location (personal first, then the tenant’s) and is asked to pick one only when there is none |
| Items with categories, EAN, type / sub-type | Doc Item Maintenance | Category filters and grouping |
| Pricing schemes | Pricebook | Stock Balance Pricing Report |
| Batch / serial tracking on items | Inventory Item Maintenance | Batch expiry and serial reports are empty otherwise |
No GL codes, numbering or document settings are needed; the applet writes nothing.
Applet settings
Settings > Application Settings is the applet’s own screen, not the shared Field Settings screen other applets use; it has four tabs (Sidebar Menu, Advanced Search, Stock Report Listing, Item Category Group).
| Tab | Setting | What it controls | Default | Effect when changed |
|---|---|---|---|---|
| Sidebar Menu | HIDE_<REPORT>_MENU — one per report, e.g. HIDE_STOCK_MOVEMENT_REPORT_MENU, HIDE_STOCK_AGING_REPORT_MENU, HIDE_HISTORICAL_STOCK_BALANCE_MENU, HIDE_STOCK_BALANCE_REPORT_NEW_MENU, HIDE_STOCK_BALANCE_REPORT_MENU (Pricing), HIDE_STOCK_BALANCE_REPORT_WITH_SERIAL_MENU … (key = route in upper case) | Removes the report from the sidebar | off | Hidden unless the user holds the matching SHOW_<REPORT>_MENU permission |
| Stock Report Listing | HIDE_MA_COST | Unit Cost / Total Cost / MA value columns on every report | off | Reopened per user by SHOW_MA_COST |
| Stock Report Listing | HIDE_GP, HIDE_GP_PERCENTAGE | Gross profit and GP % columns (Movement, Summary by Location, Sales and Purchase) | off | Reopened by SHOW_GP / SHOW_GP_PERCENTAGE if granted (not seeded in the registry) |
| Stock Report Listing | ADVANCED_SEARCH_SHOW_COST_MA, …COST_WA, …COST_FIFO, …COST_LIFO, …COST_REPLACEMENT, …COST_MANUAL, …REF_PRICE1–3, …DELTA_PRICE1–3, …REBATE_PRICE1–3, …SALES_MIN_PRICE, …SALES_MAX_PRICE, …PURCHASE_MIN_PRICE, …PURCHASE_MAX_PRICE, …REPORT_UNIT_REPLACEMENT_COST, …REPORT_UNIT_MANUAL_COST, …REPORT_UNIT_COMMISSION, …REPORT_UNIT_REBATE | Which cost / price bases can be chosen in Advanced Search and appear as columns | off | The setting alone decides, for every user. Turn a basis on and anyone who can run the report can choose it; turn it off and nobody can, whatever permission they hold. The SHOW_ADVANCED_SEARCH_<BASIS> permissions in the registry are no longer consulted. The four …REPORT_UNIT_* toggles change nothing — no report offers those bases |
| Stock Report Listing | AGING_PERIOD_TYPE | Month (default) or day buckets on the Aging report | Month | Day mode takes its ranges from the definition selected under Aging Period Settings; with none selected there are no day columns to show |
| Stock Report Listing | PRICING_SCHEMES | Pricing schemes listed on the Stock Balance Pricing Report | none | — |
| Item Category Group | Category groups 0–20 | Which item category levels are offered as filters, each with its label list and a visibility toggle | — | — |
Settings > Default Selection — three values, three different effects. Location: the personal Default Selection pre-fills the location picker in every report’s search panel; the tenant value is used only by the Movement report, as the fallback described under Before you can use it. Branch: no report or search field reads it. Language: switches the applet’s screen language (personal first, then tenant, then English) — it does not filter anything. Settings > Aging Period Settings — a list of aging-period definitions; selecting one stores the definition and its month / day type together (so it also changes AGING_PERIOD_TYPE), and clearing the selection clears both. Settings > Custom Resource Bundle Configuration — relabel menu names and column headers.
The Stock Balance Pricing Report has its own column keys HIDE_LISTING_SALES_PRICE, HIDE_LISTING_PURCHASE_PRICE, HIDE_LISTING_SALES_MIN_PRICE, HIDE_LISTING_SALES_MAX_PRICE, HIDE_LISTING_REF_PRICE_1–3, HIDE_LISTING_DELTA_PRICE_1–3, HIDE_LISTING_REBATE_PRICE_1–3, HIDE_LISTING_REPLACEMENT_PRICE, read from the same settings record; they are not on the settings screen and their SHOW_LISTING_* counterparts are not registered.
INCLUDE_* / ENABLE_* dimension and tax keys, PRINTABLE, and the ten HIDE_<REPORT> keys without the _MENU ending are declared in the settings model but unused — the sidebar reads only the …_MENU keys.
Document behaviour settings
Not applicable — the applet has no documents, statuses or printables.
Feature visibility / permissions
Registered client-side permissions for stockReport (all ACTIVE):
| Permission | Unlocks |
|---|---|
SHOW_STOCK_MOVEMENT_REPORT_MENU, SHOW_STOCK_AGING_REPORT_MENU, SHOW_STOCK_SUMMARY_REPORT_BY_LOCATION_MENU, SHOW_HISTORICAL_STOCK_BALANCE_MENU, SHOW_STOCK_SALES_PURCHASE_BY_ITEM_CODE_MENU, SHOW_STOCK_VALUE_BY_LEVEL_MENU, SHOW_BATCH_EXPIRY_DATE_MENU, SHOW_STOCK_BALANCE_REPORT_NEW_MENU, SHOW_STOCK_BALANCE_SUPPLIER_SERIAL_BATCH_MENU, SHOW_STOCK_BALANCE_REPORT_MENU, SHOW_STOCK_BALANCE_REPORT_WITH_SERIAL_MENU, SHOW_STOCK_BALANCE_REPORT_SUPPLIER_SERIAL_MENU, SHOW_ITEM_PRICE_CHANGE_MENU | The report when its menu is hidden tenant-wide |
SHOW_MA_COST | Cost columns when HIDE_MA_COST is on |
SHOW_UNIT_COST, SHOW_TOTAL_COST, SHOW_OPEN_INVENTORY_VALUE, SHOW_CLOSING_INVENTORY_VALUE, SHOW_OPEN_BALANCE_VALUE, SHOW_CLOSING_BALANCE_VALUE | Nothing. No report reads them; the columns they name follow HIDE_MA_COST / SHOW_MA_COST |
SHOW_ADVANCED_SEARCH_COST_MA … SHOW_ADVANCED_SEARCH_REPORT_UNIT_REBATE (23) | Nothing. Advanced Search stopped consulting them in July 2026; the ADVANCED_SEARCH_SHOW_* setting alone decides |
SHOW_STOCK_MOVEMENT_REPORT, SHOW_STOCK_AGING_REPORT, SHOW_STOCK_BALANCE_REPORT, SHOW_HISTORICAL_STOCK_BALANCE, SHOW_STOCK_SUMMARY_REPORT_BY_LOCATION, SHOW_STOCK_SALES_AND_PURCHASE_BY_ITEM_CODE, SHOW_STOCK_VALUE_BY_LEVEL_REPORT, SHOW_BATCH_AND_EXPIRY_DATE_REPORT, SHOW_STOCK_BALANCE_REPORT_WITH_SERIAL, SHOW_STOCK_BALANCE_BY_ITEM_SUPPLIER_BATCH_EXPIRY_REPORT, SHOW_ITEM_PRICE_CHANGE_REPORT | Nothing. Legacy per-report codes; the applet reads none of them |
So of the 54 codes you can grant, the twelve live …_MENU codes and SHOW_MA_COST act; SHOW_ITEM_PRICE_CHANGE_MENU names a report that is off the menu, and the rest change nothing. Granting one of them is harmless, but it is not how to give someone a column or a cost basis.
Cost and profit visibility is therefore two-layered: the tenant hides with HIDE_MA_COST / HIDE_GP, and finance users get the columns back through SHOW_MA_COST (and SHOW_GP where seeded). Server-side, each report’s data call is refused without the corresponding API_TNT_DM_ERP_*_READ permission.
Fields
The applet has no create or edit forms. The search panel fields are listed under Common controls; the per-report column sets are listed with each report above.
Lifecycle and effects
Not applicable — read-only reports. Movement, Aging, Summary by Location, Historical Stock Balance and Sales and Purchase are recomputed from the stock ledger when you run them, as at the dates you choose; Stock Balance Report, the Pricing and With Serial reports, Stock Value By Level and Batch and Expiry read the stored balance rows, which show the position now; By Item, Supplier and Batch Expiry reads the batch entries on the ledger lines, and By Supplier with Serial reads finalised purchase lines beside the company’s balance row now.
Related applets
- Stock Balance and Stock Availability — the live per-location figures; use them to confirm a balance this report questions.
- Stock Transfer — open transfer queue quantity is the Stock In Transit column.
- Stock Adjustment — adjustments are the Adj column; serial adjustments appear as
SN_ADJmovement rows; Reset MA appears asRSTMVA. - Stock Take — the Stock Balance With Serial report doubles as a count sheet.
- Inventory Item Maintenance, Doc Item Maintenance — item type, sub-type, categories.
- Pricebook — pricing schemes on the Pricing report.
- Financial Report — closing stock in the ledger.
- Organisation — locations and labels.
Troubleshooting
| Symptom | Cause | Fix |
|---|---|---|
| “Please select at least one location” (Movement report) | Non-administrator with no location chosen, no location-scoped read permission and no Default Selection location | Select a location; grant location read permissions, or set a Default Selection location |
| Search returns nothing | Keyword shorter than three characters, or filters too narrow | Use three or more characters; widen date range and location |
| Cost, value or GP columns missing | HIDE_MA_COST / HIDE_GP on and the user lacks SHOW_MA_COST / SHOW_GP | Grant the permission or turn the setting off |
A cost basis is missing from Advanced Search — for everyone, including users granted SHOW_ADVANCED_SEARCH_<BASIS> | ADVANCED_SEARCH_SHOW_<BASIS> is off; the permission is no longer consulted | Turn it on in Application Settings > Advanced Search. It then appears for every user of the report |
A SHOW_UNIT_COST, SHOW_TOTAL_COST or other value permission was granted and nothing changed | The applet reads none of those codes | Use SHOW_MA_COST (cost and value columns) or clear HIDE_MA_COST |
| Report missing from the sidebar | HIDE_<REPORT>_MENU set | Grant SHOW_<REPORT>_MENU or clear the setting |
| Historical Stock Balance closing differs from Summary by Location closing | Quantities read off the same ledger line agree for the same locations, items and end date. Values differ: Summary prices at the company’s last ledger line of any kind before the end date, Historical at the last ordinary or Reset MA line, and Historical drops an item with no such line | Check that both were run for the same locations and filters; compare the value item by item |
| A few items are off in Historical Stock Balance while the rest are right | Not lines that share a moment: the report reads the balance after the last of them, in the order the balance was built. Look instead for a back-dated document whose re-costing has not caught up, a later line of a type the report does not read (only ordinary document movements and the two stock-sync types count), or an item with no costed movement at the company, which drops it | Open the item on Stock Movement Report for that location and compare its balance after the last line on or before the date. If the two agree, the report is right and the expectation is wrong; if they differ, look for a back-dated document or a line of another type near the date |
| An item that has stock is missing from Historical Stock Balance | It has no purchase-and-sales or Reset MA ledger line at that company before the date, so no cost is found and the row is dropped | Read its quantity from Stock Movement Report’s balance for that item and location |
| Corrected serial number shows in Stock Balance With Serial but the Movement report still shows the old one | Fixed in 2026 — the movement query now includes SN_ADJ rows | Update the backend; tick Include SN Adjustment |
| Trade-in stock missing from Historical Stock Balance | Trade-in (non-stock trade-in) stock is not yet included | Open enhancement; use the Non-Stock and Trade-In applet’s own listing |
| Aging report shows negative quantities or wrong amounts | Fixed in 2026 (returns and adjustments were mis-signed) | Update the backend |
| Wrong amount for foreign-currency documents on the Movement report | Fixed in 2026 — transaction currency amount was shown instead of the company amount | Update the backend |
| Grid filter not reset after a new search | Known grid behaviour | Clear the column filter before searching again |