Sales Report Applet
Purpose and Overview
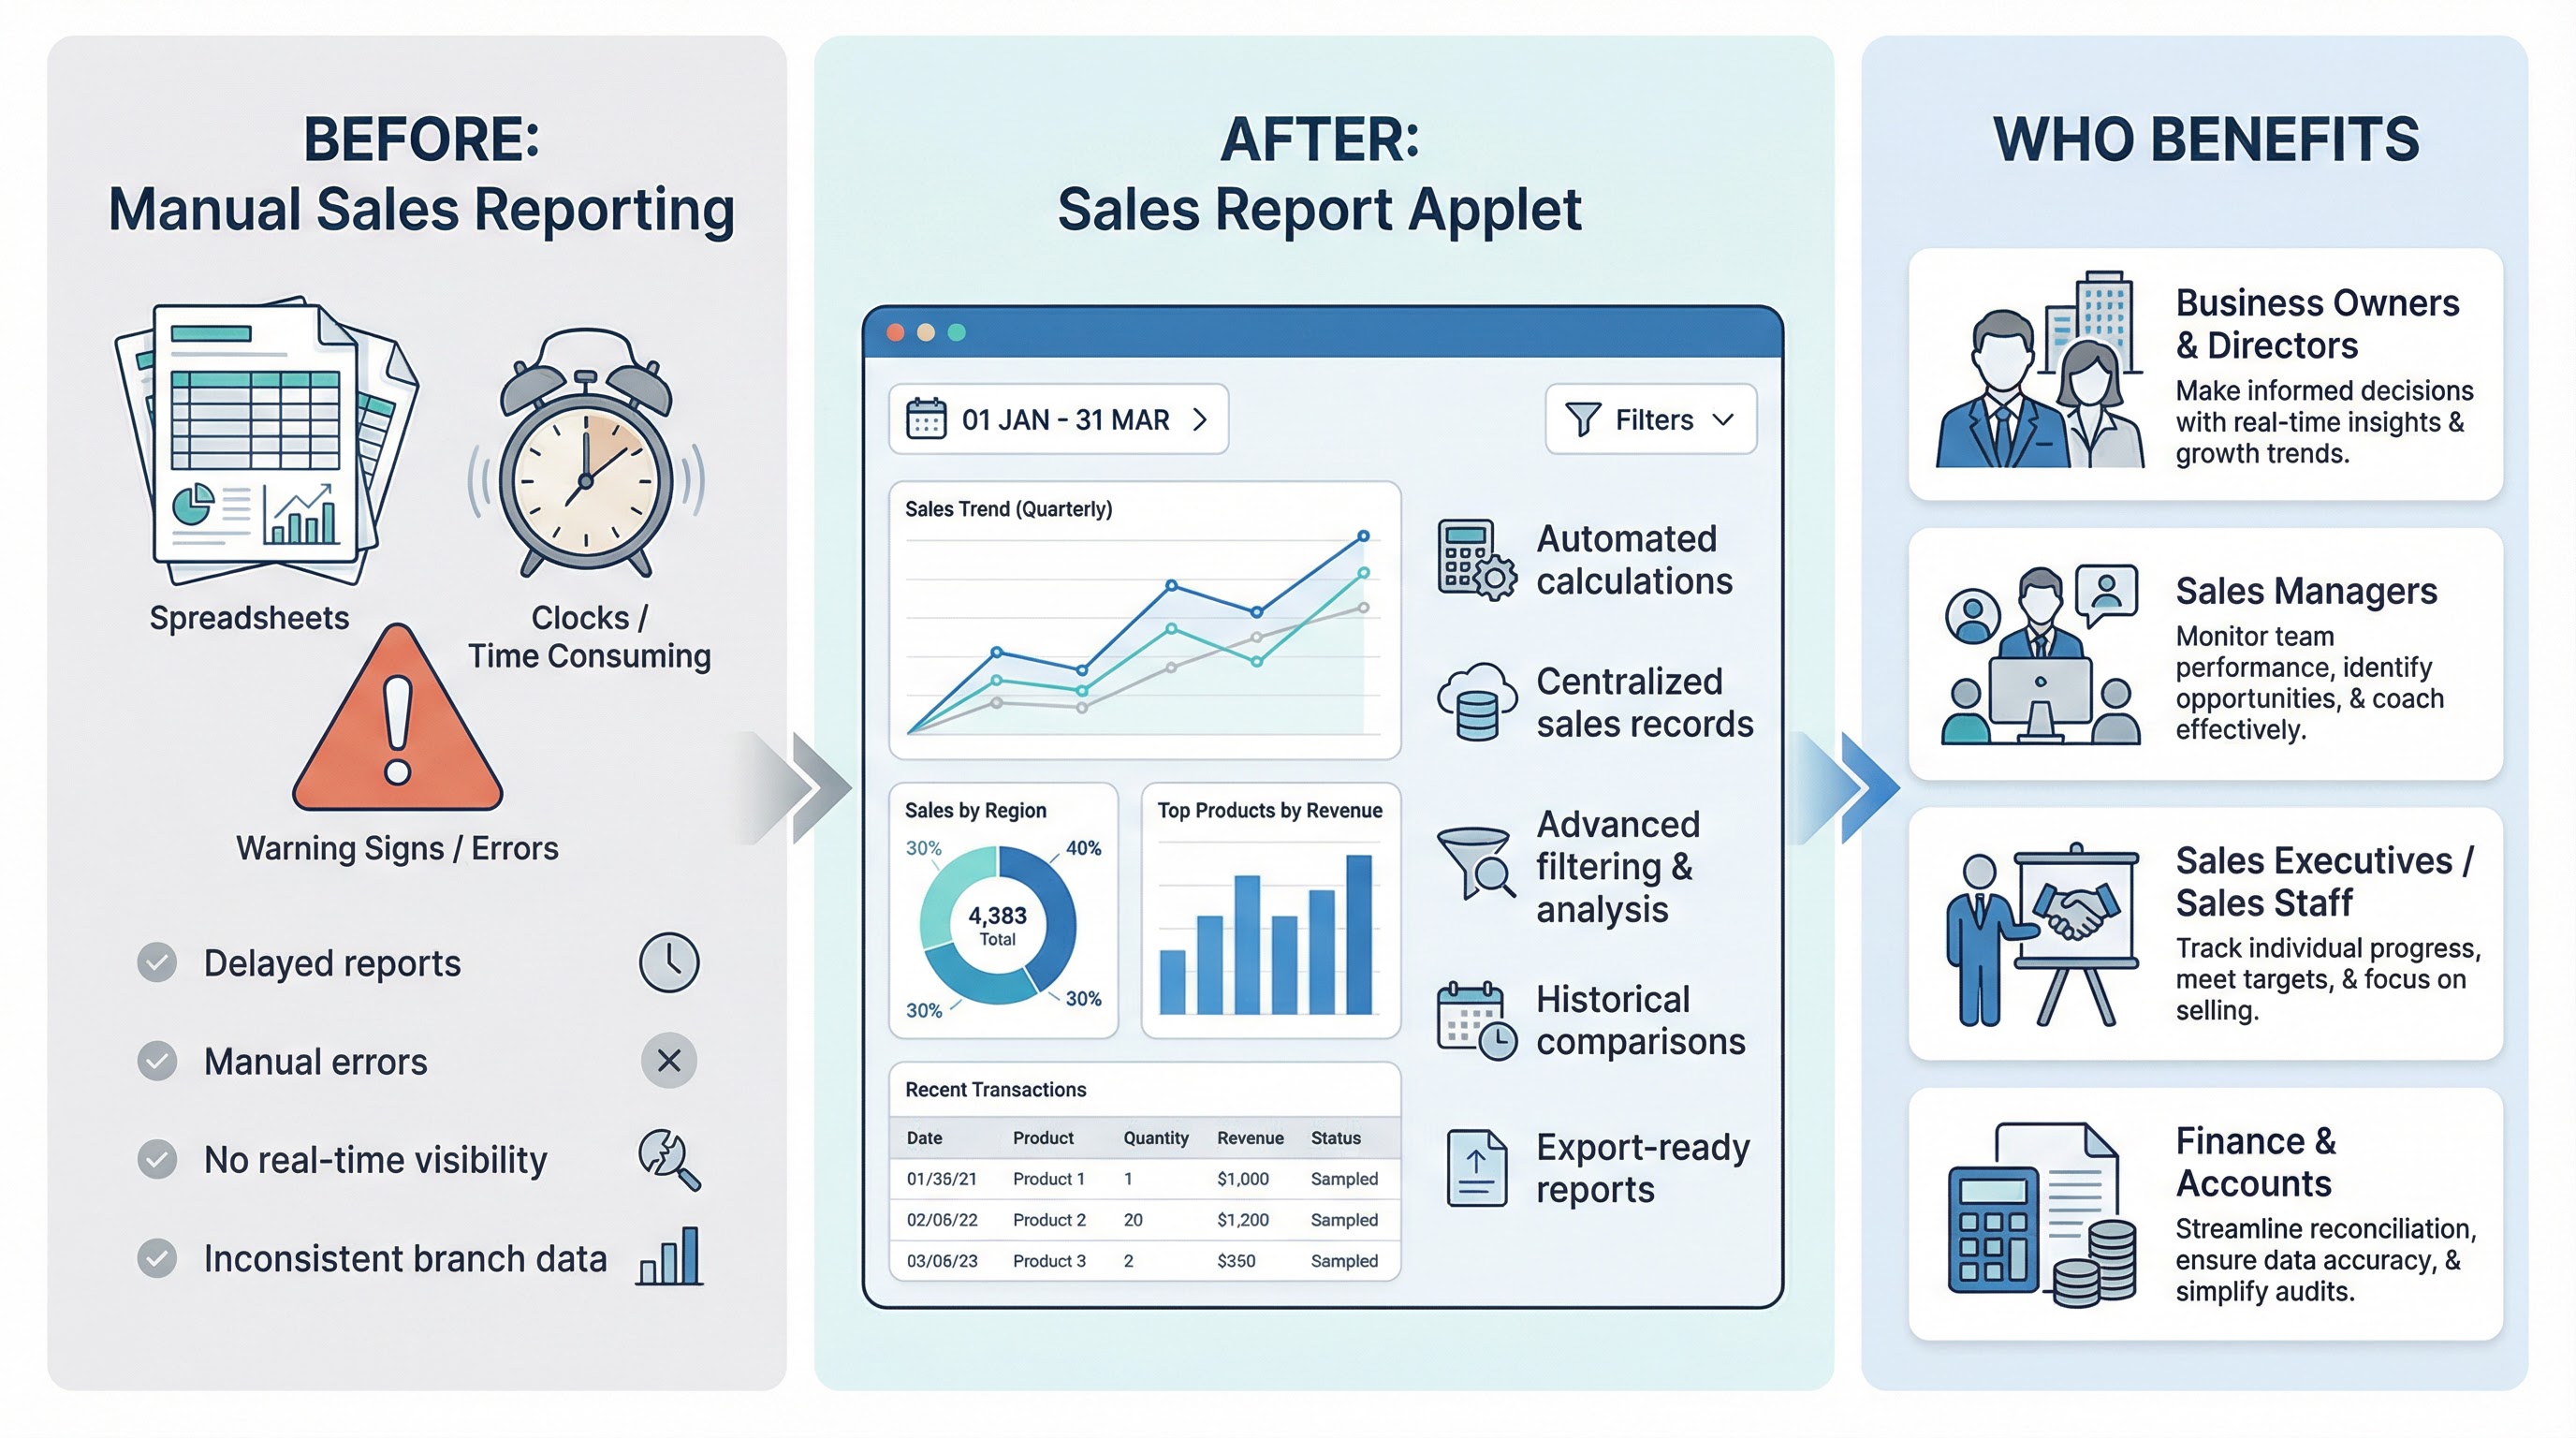
The Sales Report Applet is a powerful tool designed to analyze sales records and performance. It helps teams track revenue, monitor trends, and spot opportunities or issues over time. The applet lets users review, compare figures and periods; and assess team or product performance—providing the data and views needed to support data-driven decisions.
Key Features Overview
Who Benefits from This Applet?
Business Owners & Directors:
- Real-time visibility into overall sales performance
- Clear revenue tracking across periods (daily, monthly, yearly)
- Identification of top-performing products, branches, or sales teams
- Data-driven strategic decision-making
- Improved financial control and business growth planning
Sales Managers:
- Monitor team sales performance efficiently
- Track achievement against sales targets
- Analyze sales trends and product performance
- Identify underperforming areas and take corrective action
- Generate performance reports for review meetings
Sales Executives / Sales Staff:
- View personal sales performance and transaction history
- Track progress toward assigned sales targets
- Improve accountability and performance transparency
- Access historical sales data for customer follow-up
Finance & Accounts Teams:
- Accurate revenue verification and reconciliation
- Exportable sales reports for accounting and audit purposes
- Support tax reporting and financial statement preparation
- Reduced manual compilation of sales data
- Improved reporting accuracy and consistency
Operations & Inventory Teams:
- Identify fast-moving and slow-moving products
- Support demand forecasting and stock planning
- Monitor the impact of sales on inventory levels
- Improve replenishment planning
What Problems Does This Solve?
The Manual Sales Reporting Problem:
Traditional sales reporting often relies on spreadsheets and manual compilation. Common issues include:
- Delayed compilation of daily and monthly sales reports
- Human errors in manual calculations
- Limited visibility into real-time sales performance
- Inconsistent data across branches or departments
- Difficulty tracking historical sales records
- Time-consuming reconciliation with finance and inventory teams
- Lack of centralized reporting for management review
The Sales Report Applet Solution:
- Automated calculations - Accurate totals, summaries, and performance metrics without manual errors
- Centralized data management - All sales records stored securely in one system
- Advanced filtering & analysis - Analyze sales by date, branch, product, salesperson, or customer
- Performance visibility - Monitor individual, team, and company-wide sales performance
- Historical tracking - Access and compare past sales data for trend analysis
- Export-ready reports - Generate reports suitable for finance, audit, and management review
- Integration ready - Seamlessly supports accounting, inventory, and financial modules
Key Features Overview
Key Concepts
Understanding the Sales Report Framework
The Sales Report Applet organizes data so you can answer the right business questions:
| Aspect | Component | Practical Example |
|---|---|---|
| Who sold? | Salesperson / Team / Branch | Top performer this month, branch comparison |
| What was sold? | Product / Item / Document | Best-selling SKU, revenue by item code |
| When did it sell? | Date / Period / Year | Daily figures, month-over-month, YoY |
| How much? | Revenue / Quantity / Margin | Totals, summaries, profitability |
A calculation set is the rule that defines how your figures are produced (e.g., by invoice date vs delivery date, and which document types count). Picking the same calculation set as your team or finance ensures you are all looking at the same definition of “sales.”
Report Hierarchy at a Glance
Organization
│
├── Period (Daily / Monthly / Yearly) ──→ WHEN
│
├── Dimension (Branch / Team / Product / Document) ──→ WHO / WHAT
│   │
│   └── Figures (Revenue, Quantity, Margin) ──→ HOW MUCH
│
└── Calculation Set & Type ──→ HOW figures are derived
Flow Through the Hierarchy:
- Period - Choose the time slice (daily, monthly, yearly)
- Dimension - Slice by salesman, branch, product, or document
- Figures - Revenue, quantity, margin—calculated from your chosen basis
- Calculation Set - Defines how figures are derived (e.g., invoiced vs delivered sales)
This structure enables:
- Accurate comparisons across periods and dimensions
- Flexible reporting by salesman, document, item code, or serial number
- Clear traceability via audit trail and report history
- Consistent metrics for finance and operations
Quick Start Guide
Get up and running quickly with these essential workflows.
For Business Owners & Directors: View Overall Performance
Goal: See real-time sales performance and key metrics in a few steps.
- Navigate: Go to Sales Report (or Reports > Sales Report) from the sidebar
- Select period: Use the period selector to choose date range (e.g., This Month, Last Quarter, YTD)
- View summary: Review revenue totals, trends, and top performers (branches, products, or teams)
- Drill down: Click into a row or use filters to compare periods or assess team/product performance
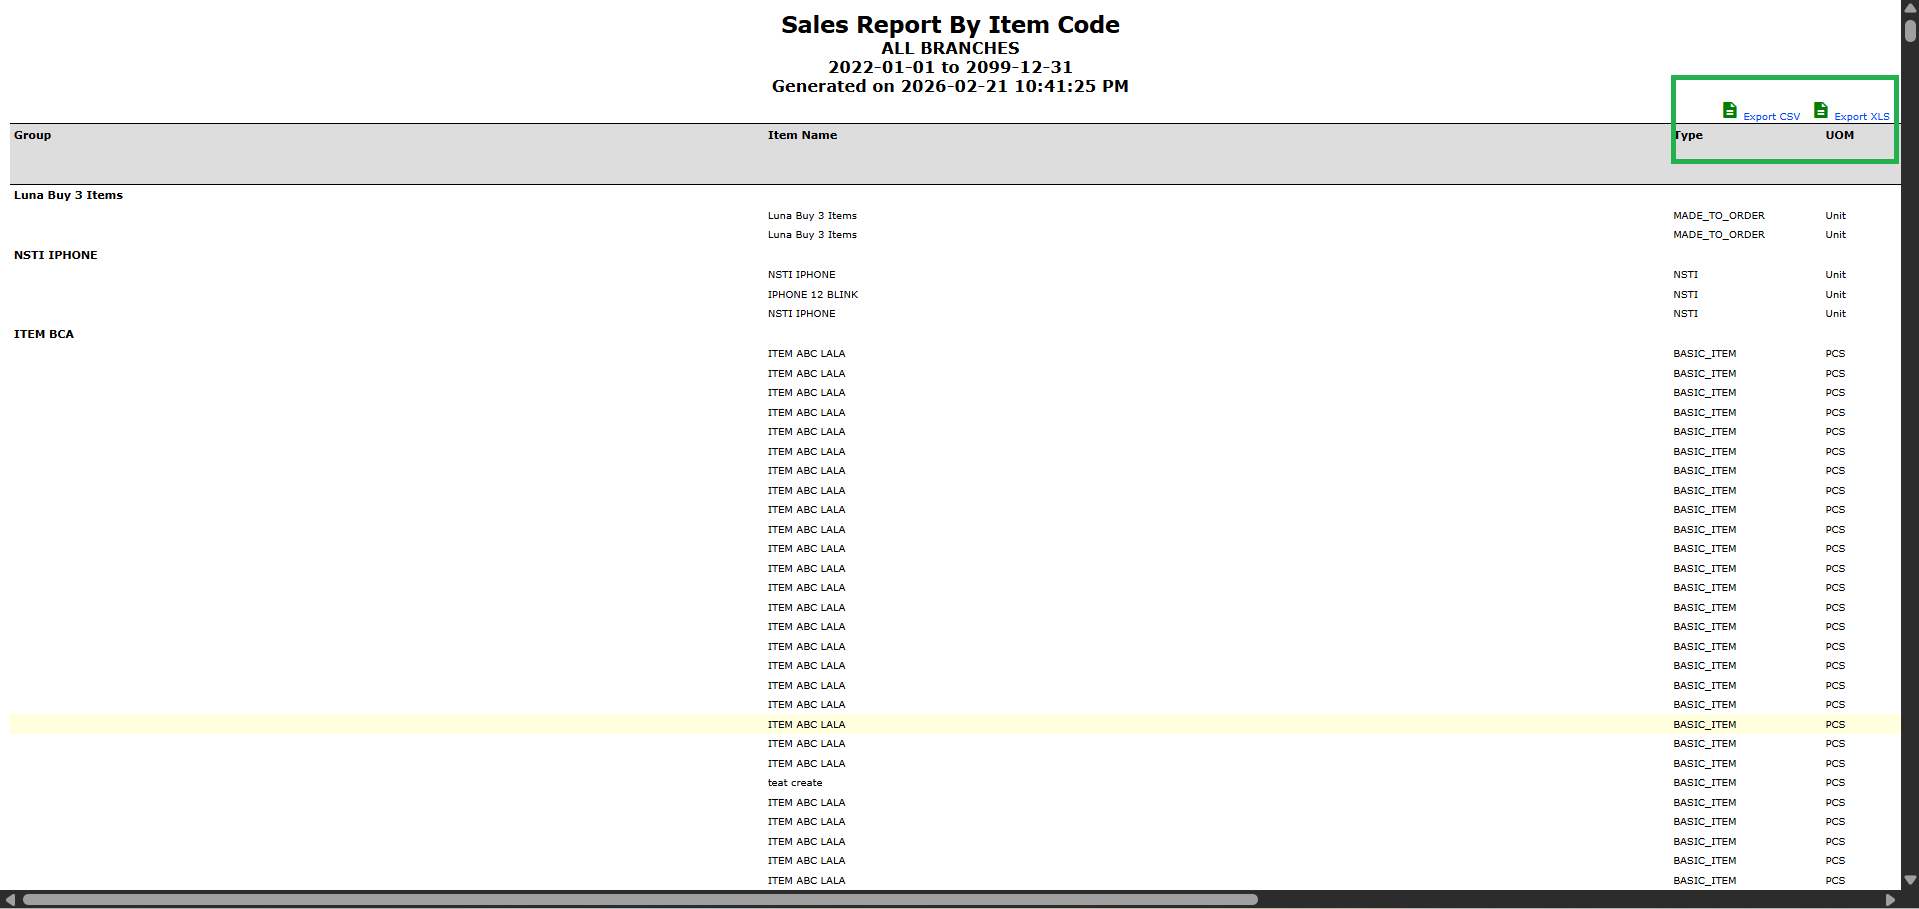
- Export: Click Export (or Print) to generate reports for board meetings or strategic planning
What happens next? Exported reports can be shared with stakeholders or used for month-end review. Refresh the view to see the latest data.
Pro Tip: Set default date ranges and favorite views in settings to speed up daily review.
For Sales Managers: Monitor Team Performance
Goal: Track team sales, targets, and trends for review meetings.
- Navigate: Go to Sales Report and select By Salesperson or Team view from the dimension dropdown or sidebar
- Set period: Select the reporting period (e.g., current month) in the date range filter
- Review performance: Check the listing or summary for individual and team figures; compare to targets if displayed
- Identify gaps: Use filters (branch, product, date) to spot underperforming areas or products
- Generate report: Click Export or Print to create performance reports for team meetings
Going on Leave? Ensure your deputy has access to the same report views or use delegation if supported.
For Sales Executives: Check Personal Performance
Goal: View your own sales figures and progress toward targets.
- Navigate: Go to My Sales (if available) or Sales Report and ensure the view is filtered to your user
- Select period: Choose daily, weekly, or monthly view from the period selector
- Review figures: See your transaction history and running totals in the listing or summary
- Track targets: Compare your numbers to assigned targets if your organization displays them in the applet
- Use history: Open past periods to pull data for customer follow-up or dispute resolution
Pro Tip: Bookmark or add My Sales / Sales Report to your favorites for quick access.
For Finance & Operations: Verify and Export Data
Goal: Reconcile revenue and export reports for accounting or inventory planning.
- Navigate: Go to Sales Report and apply filters (e.g., by document type, branch) from the filter bar
- Verify totals: Cross-check revenue and figures with source documents or the general ledger
- Select calculation set: Choose the correct calculation set (e.g., invoiced sales, delivered sales) so the basis matches finance
- Export: Click Export and select format (e.g., Excel, PDF) for accounting, audit, or tax
- Share: Send the exported file to finance or operations using your organization’s process
Pro Tip: Use the same calculation set and date range as your accounting period for consistent reconciliation.
For Admins: Initial System Setup
Goal: Get the Sales Report applet ready for users in 4 steps.
Step 1: Configure Report Types & Dimensions (Settings > Application Setting > Report Types / Dimensions)
- Enable the dimensions you need: by salesman, by document, by item code, by serial number
- Set default report type or template if the applet supports it
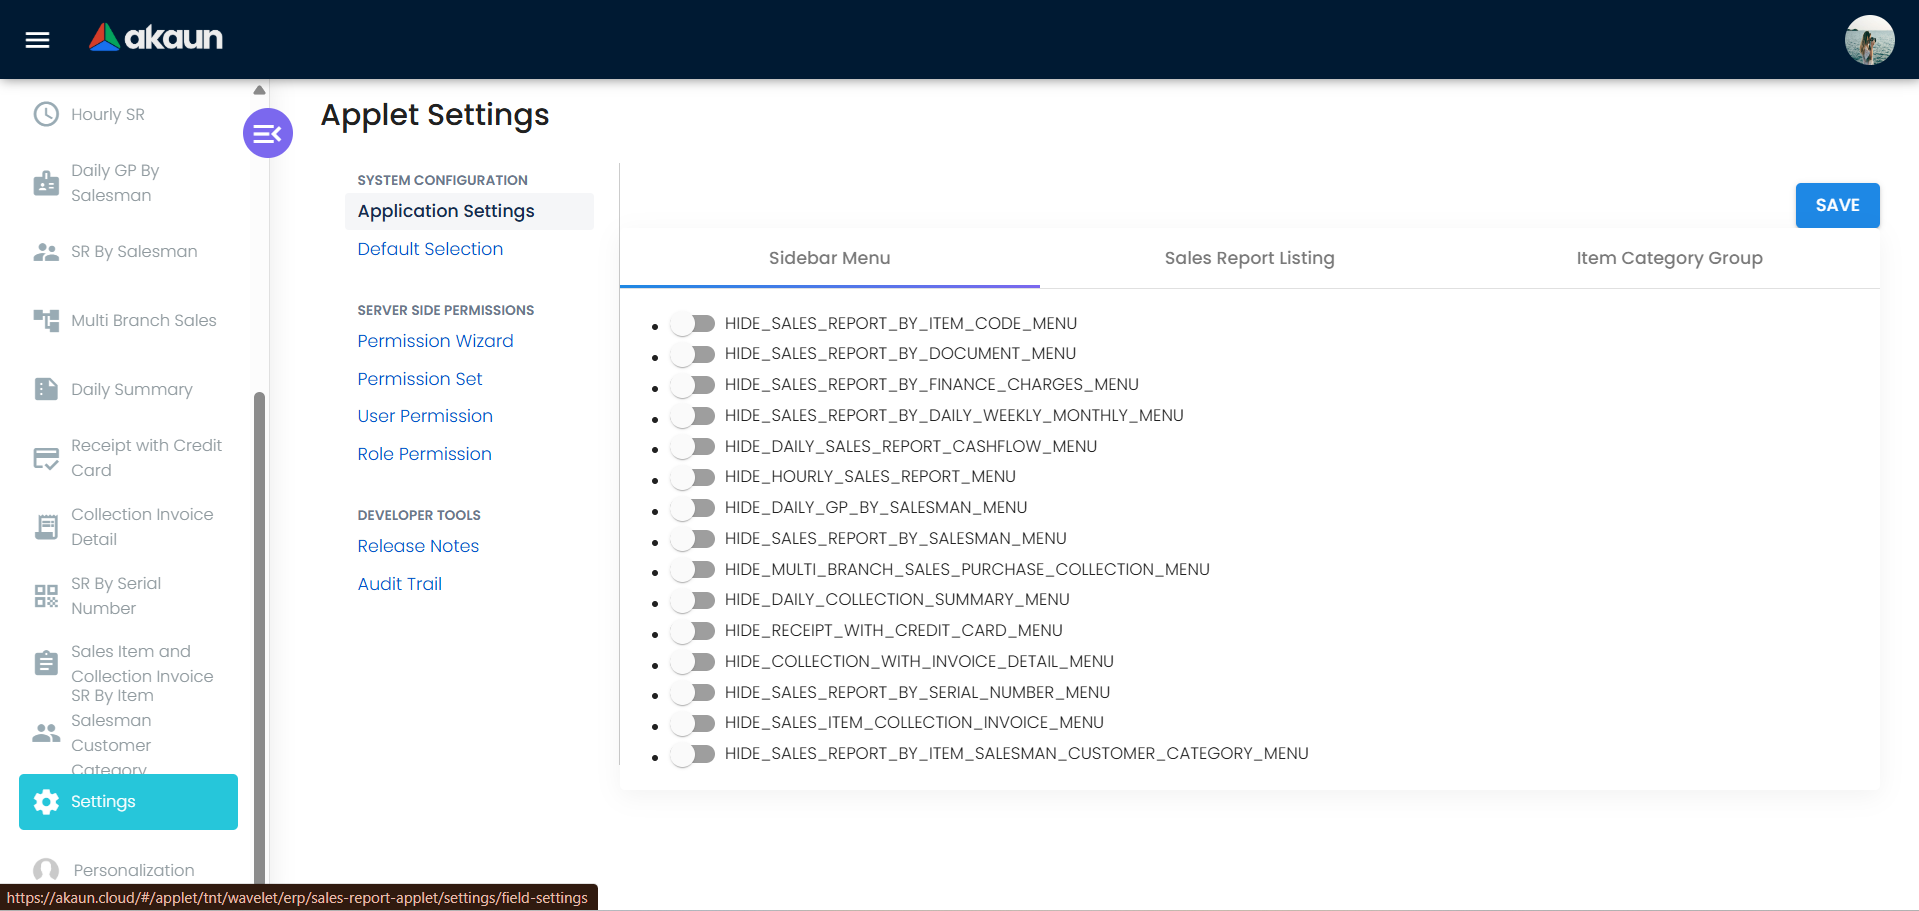
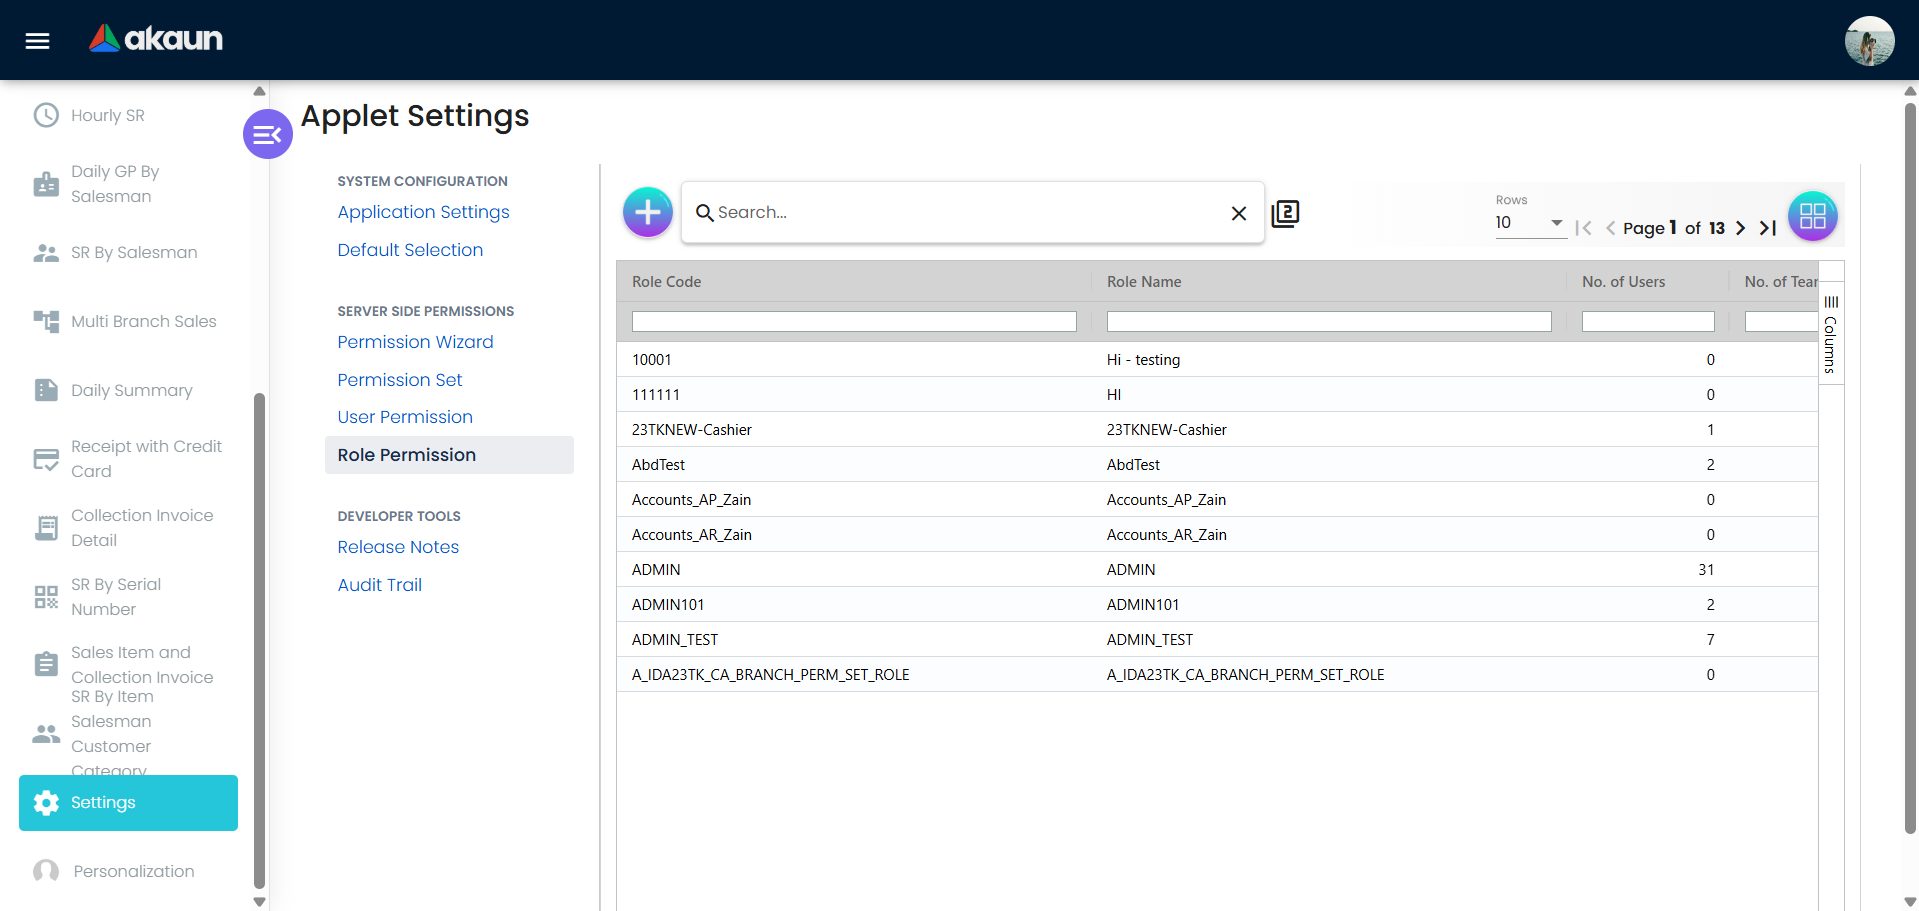
Step 2: Set Access & Permissions (Settings > Access or role permission settings)
- Grant view access by role (e.g., all staff can view; managers see team data)
- Allow export for users who need to share reports
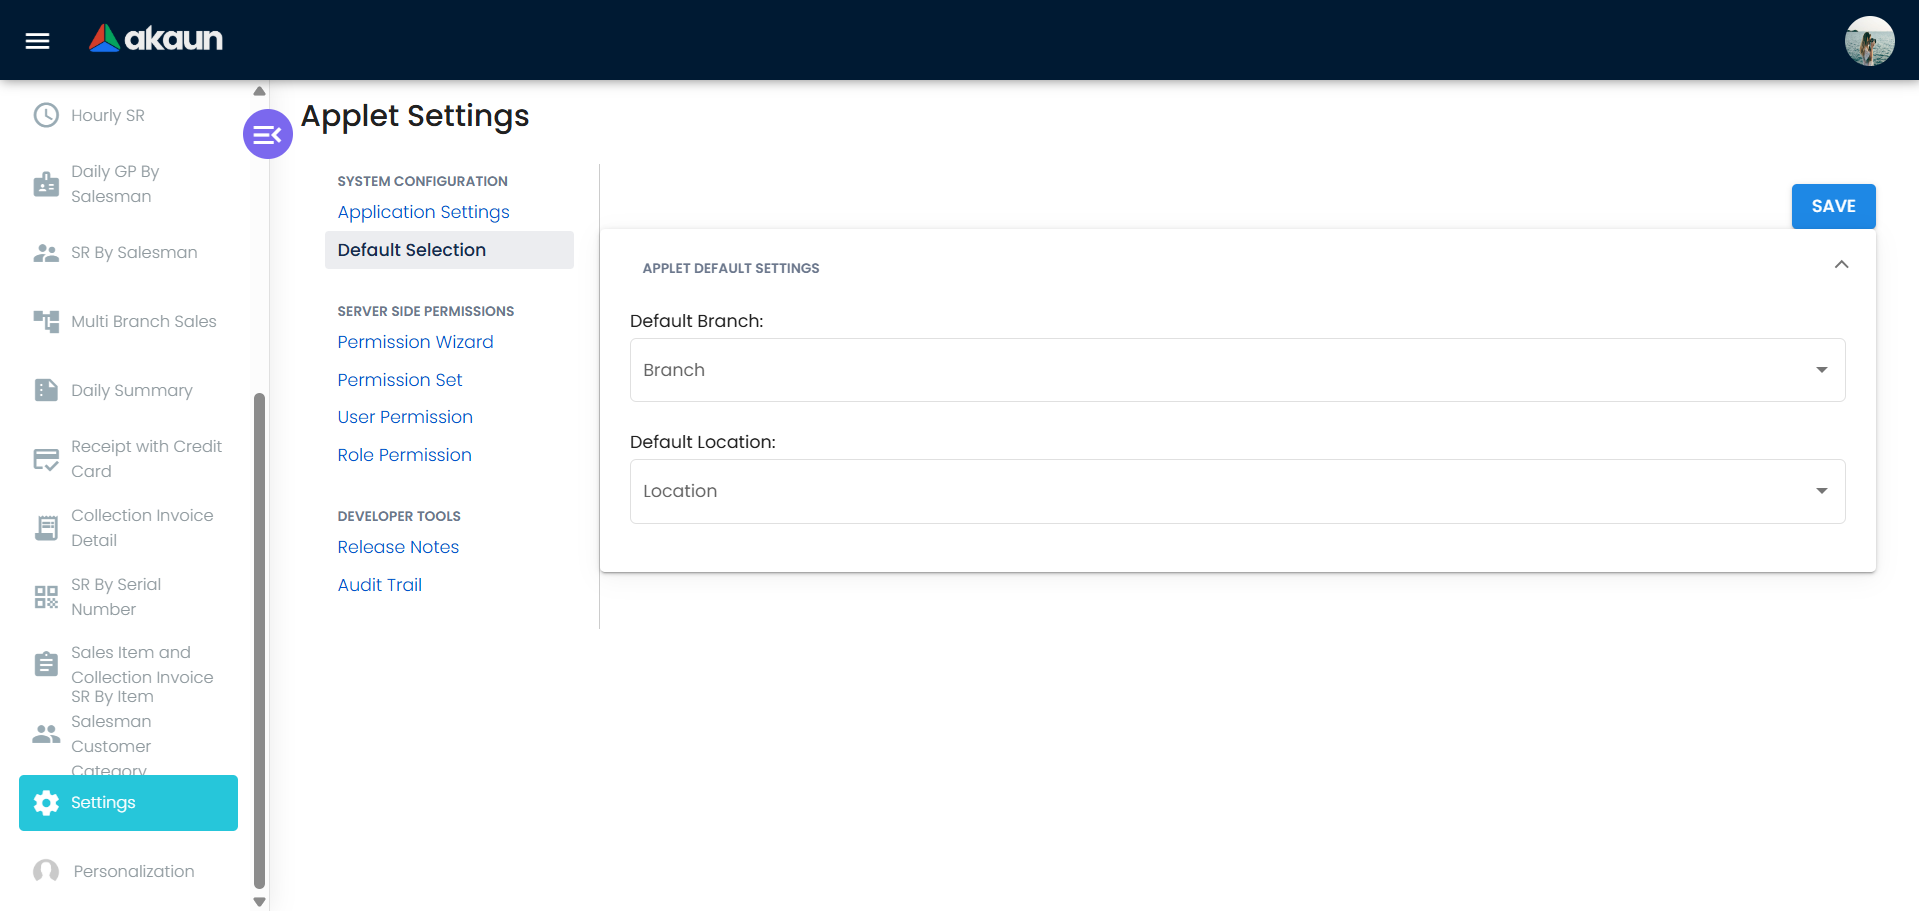
Step 3: Set Defaults (Settings > Sales Report > Default Settings)
- Set default date range (e.g., current month) and default calculation set
- Configure export formats (Excel, PDF) if applicable
Step 4: Test
- Run a report as a business owner, sales manager, and salesperson
- Export a sample report and confirm figures match expectations
Ongoing: Review calculation sets when you add new document types or change accounting rules so reports stay aligned with finance.
New to the system? Start with the basics:
- Business owners should open Sales Report and review the default summary view
- Sales managers should run a By Salesperson or By Team report for the current month
- Admins should complete Initial System Setup above, then review Configuration & Settings for detailed options
Reporting & History
Enable accurate review of past and current sales.
Reporting & History gives you a single place to review and compare sales over time, with full traceability.
What you get:
- Centralized storage of sales records
- Detailed transactional analytics
- Historical data comparison across selected periods
- Built-in audit trail for report traceability
Typical use:
- Review daily or monthly figures before closing the period
- Compare this month vs last month, or this year vs last year
- Support audits with a clear report history
Cashflow & Profitability Analysis
Helps management understand revenue flow and product profitability.
Use the applet to see not just how much was sold, but how it contributes to cashflow and profit.
What you get:
- Revenue by period (daily, monthly, yearly)
- Contribution by product, branch, or channel
- Margin or profitability views where configured
- Support for cashflow planning and strategic decisions
Multi-Dimensional Reporting
Generate reports across multiple business perspectives.
Slice sales data the way your business runs:
| Dimension | Use Case |
|---|---|
| By Salesman | Individual performance, target vs actual |
| By Document | Invoice-level or order-level analysis |
| By Item Code | Product performance, fast/slow movers |
| By Serial Number | Traceability, warranty or service follow-up |
Choose the dimension that answers your question—whether for sales meetings, inventory planning, or finance reconciliation.
Core Report Views in This Applet
Under the hood, the Sales Report Applet exposes several focused views (routes) that answer different business questions:
| Report View | Route (for reference) | What It Shows | Typical Questions Answered |
|---|---|---|---|
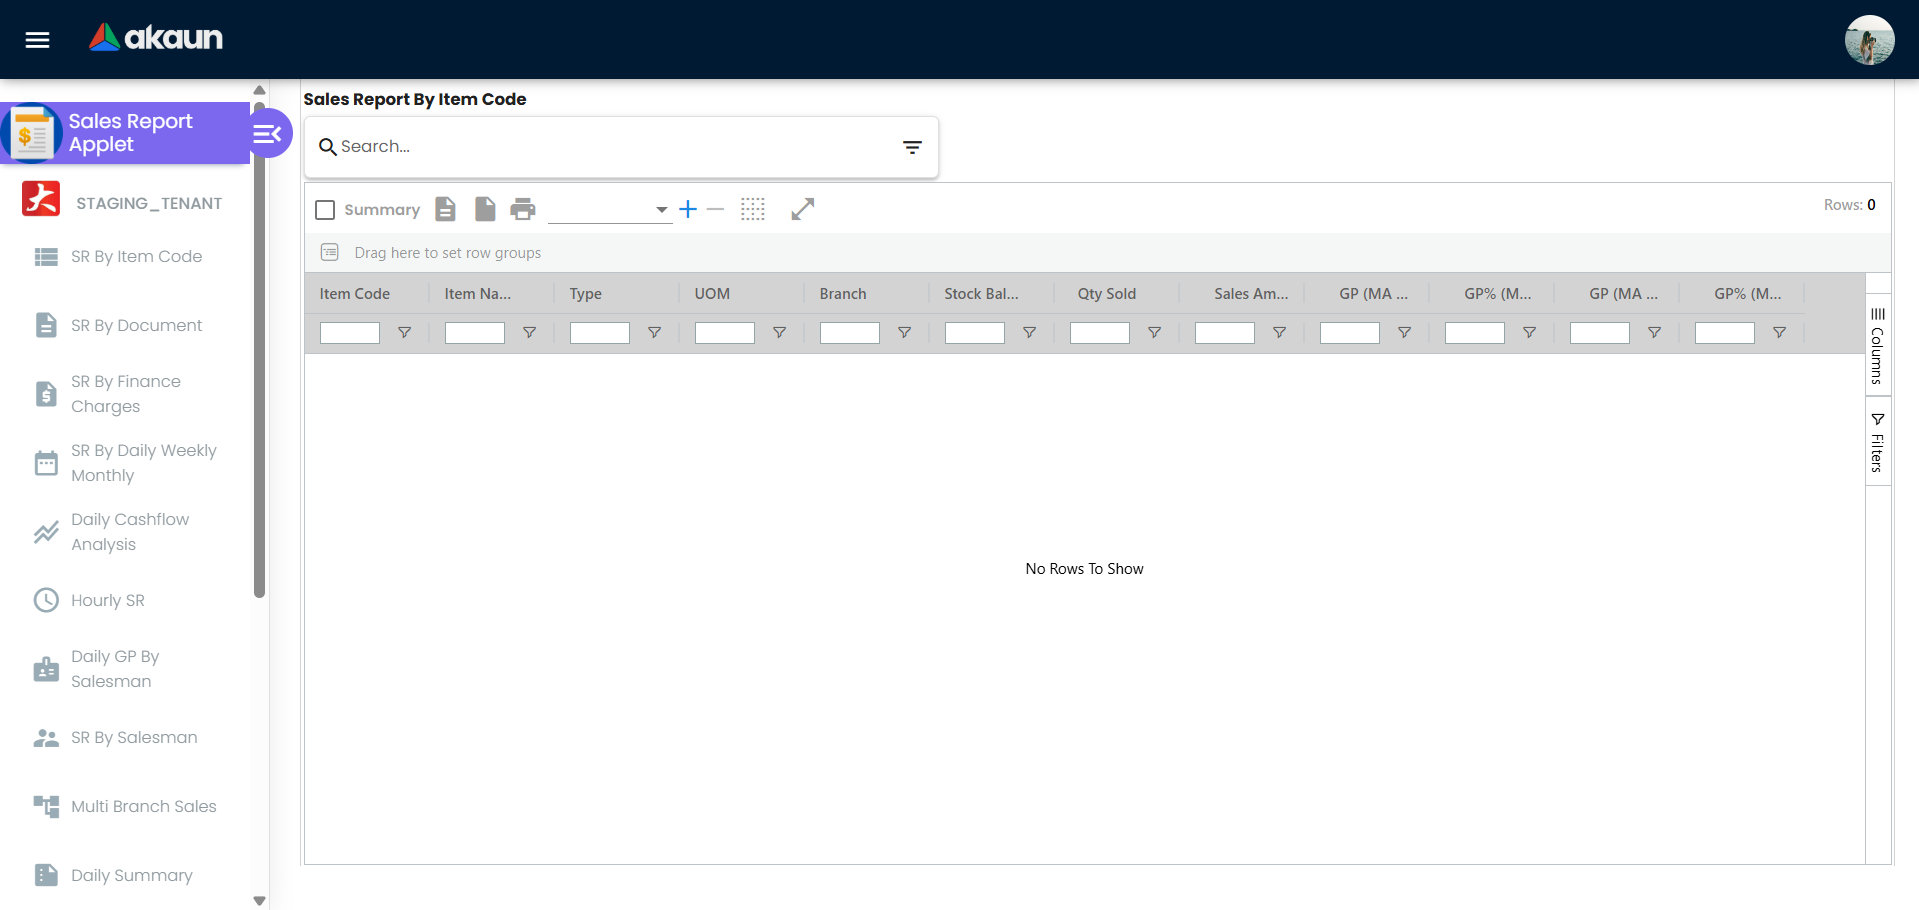
| Sales Report by Item Code | sales-report-by-item-code | Sales and margin by item/SKU, with category breakdowns and optional landed cost | Which products are fast/slow movers? Which SKUs drive the most revenue or margin? |
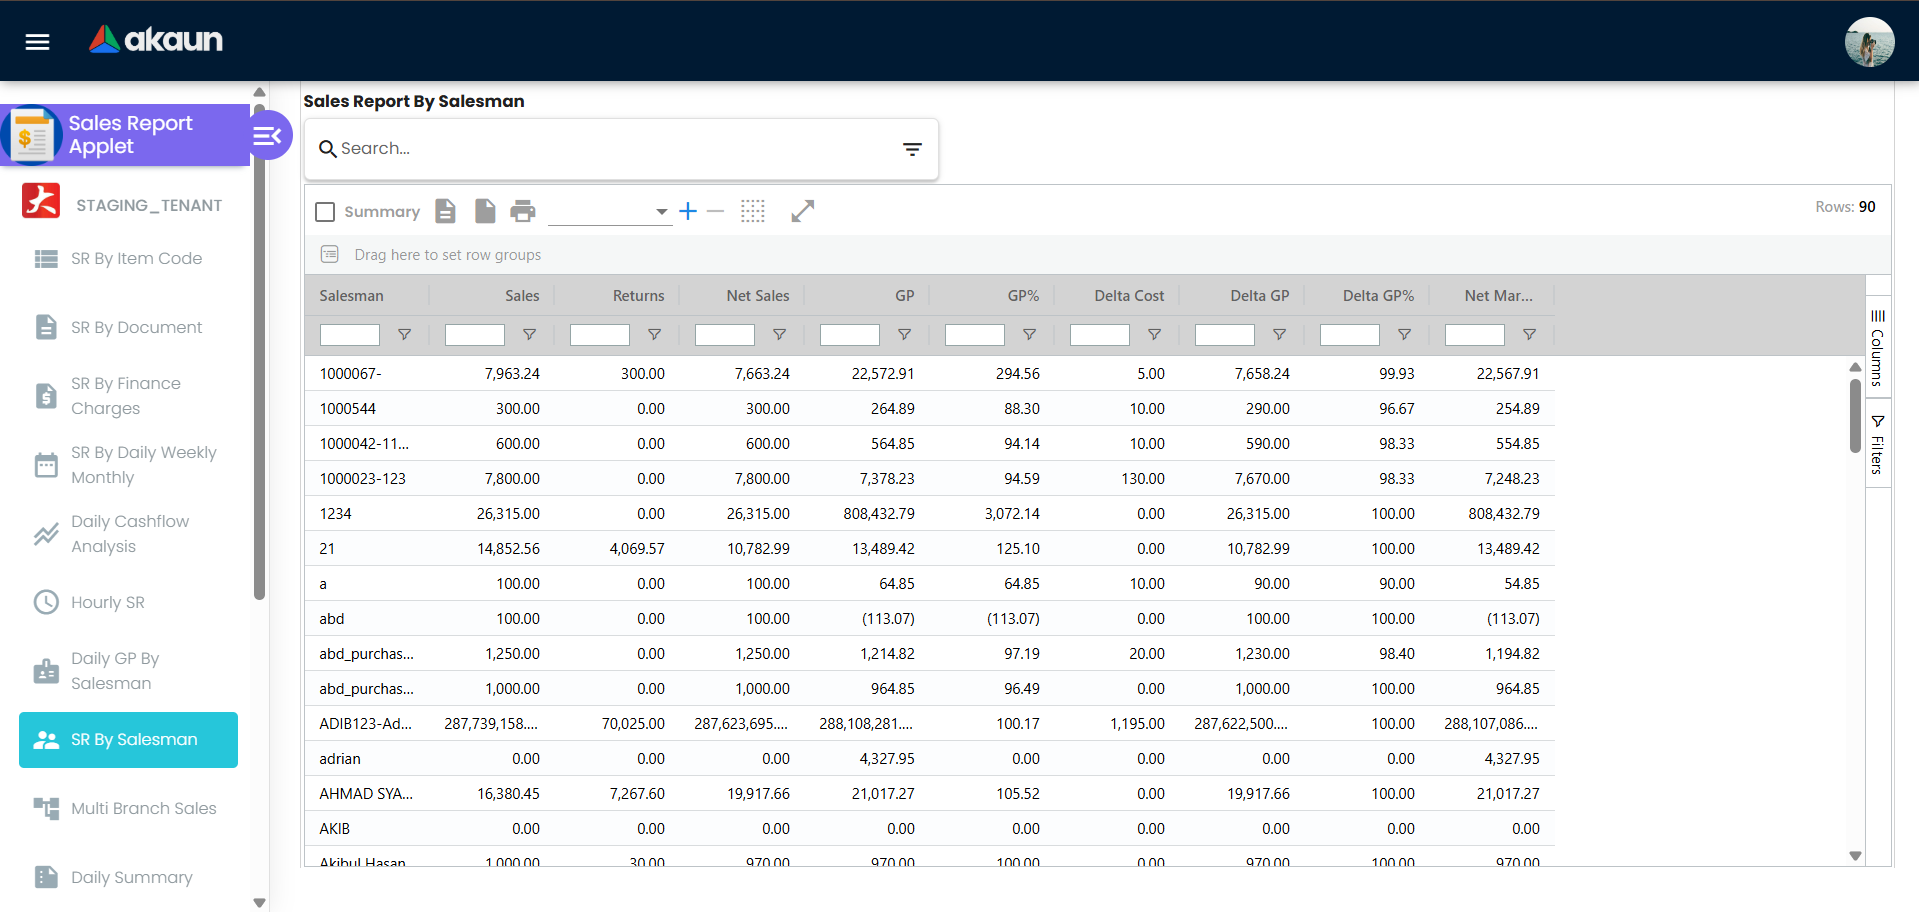
| Sales Report by Salesman | sales-report-by-salesman | Net sales, cost, GP, GP%, and deltas by salesperson | Who are my top performers? Where is margin leaking by salesperson? |
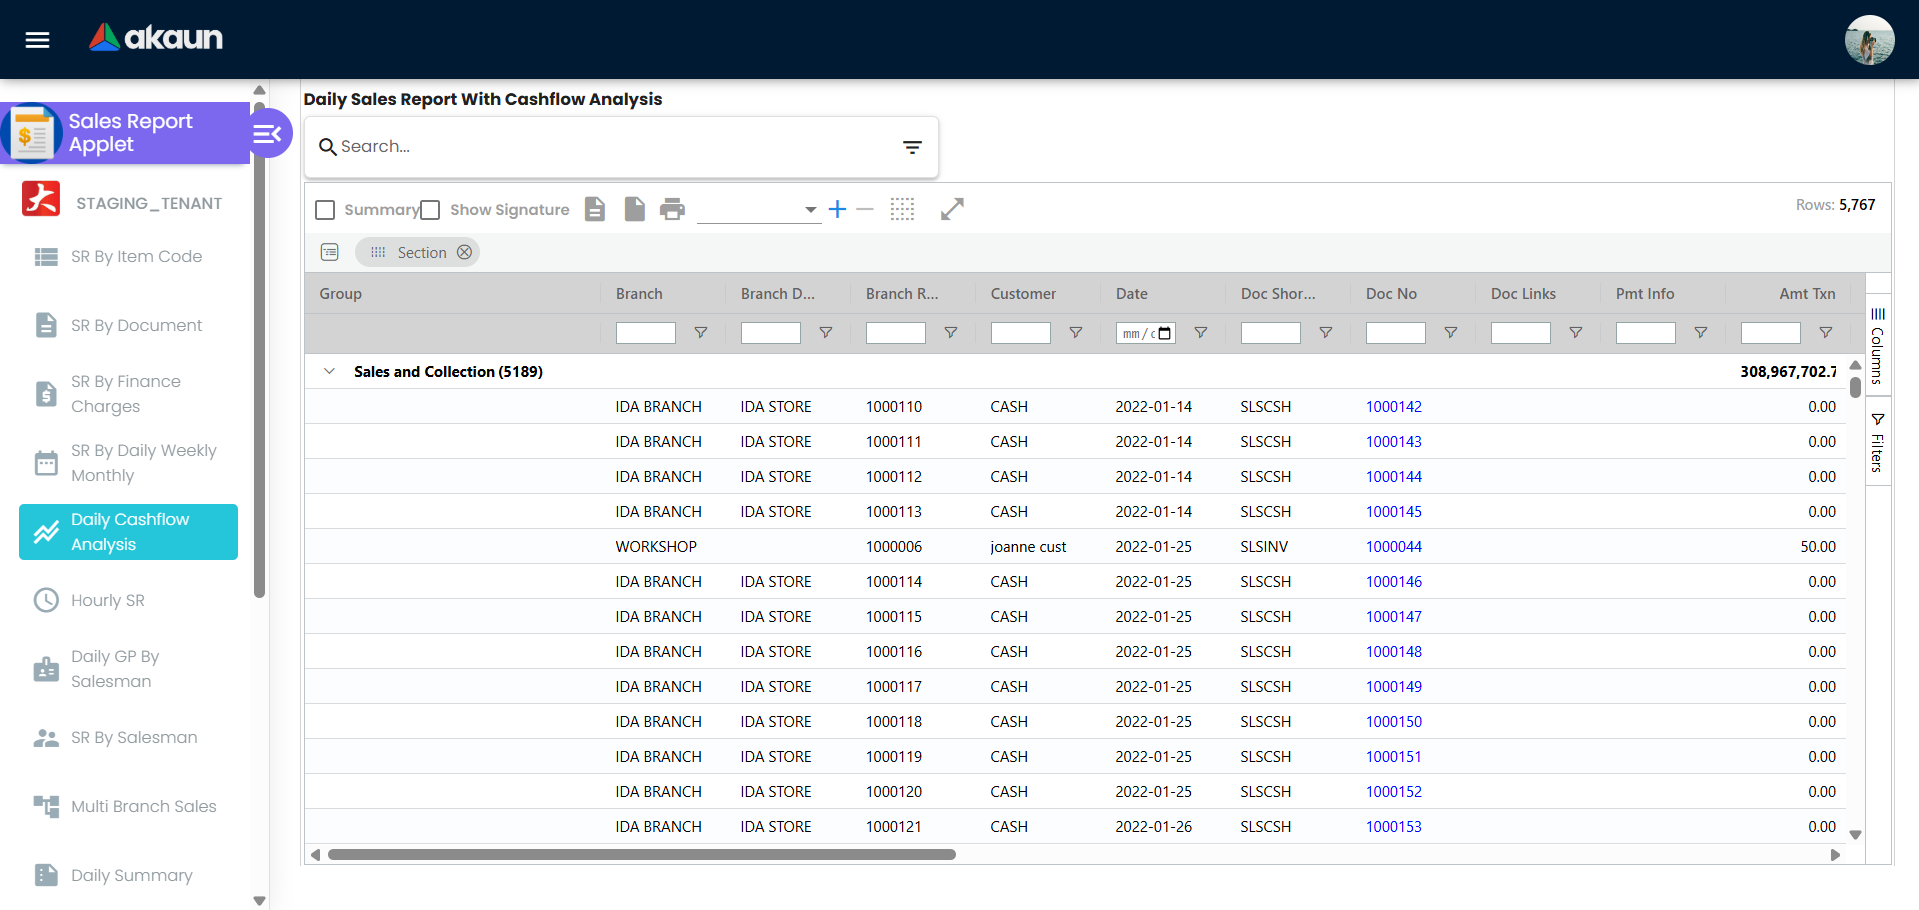
| Daily Sales Report with Cashflow Analysis | daily-sales-report-cashflow | Daily sales transactions with cashflow-related fields (payment info, document links) | What was sold today and how did it impact cashflow? Which branches or customers drove collections? |
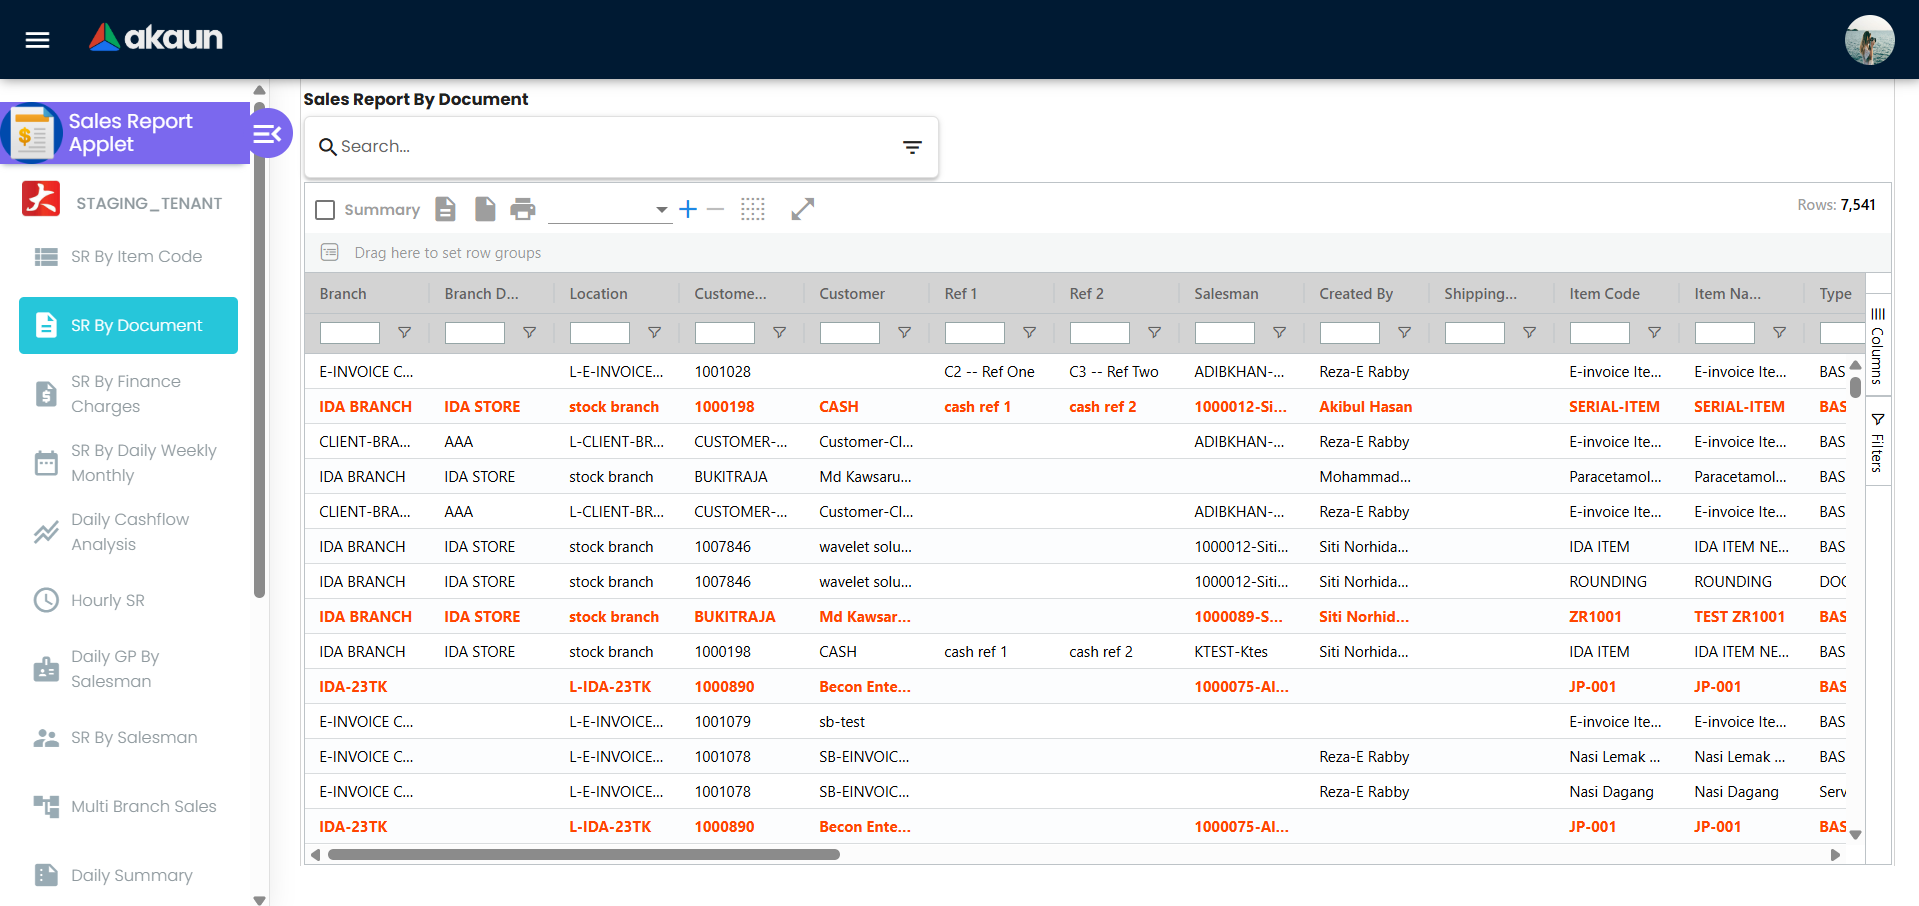
| Sales Report by Document | sales-report-by-document | Sales grouped at document level (invoices, etc.) with document metadata | Which invoices contribute most to revenue? Which documents need follow-up? |
| Sales Report by Serial Number | sales-report-by-serial-number | Sales and movement by serialised items | Where is each serialised unit now? Which customer bought a specific serial number? |
| Daily/Weekly/Monthly Summary | sales-report-by-daily-weekly-monthly | Aggregated sales by period | How are sales trending day by day, week by week, or month by month? |
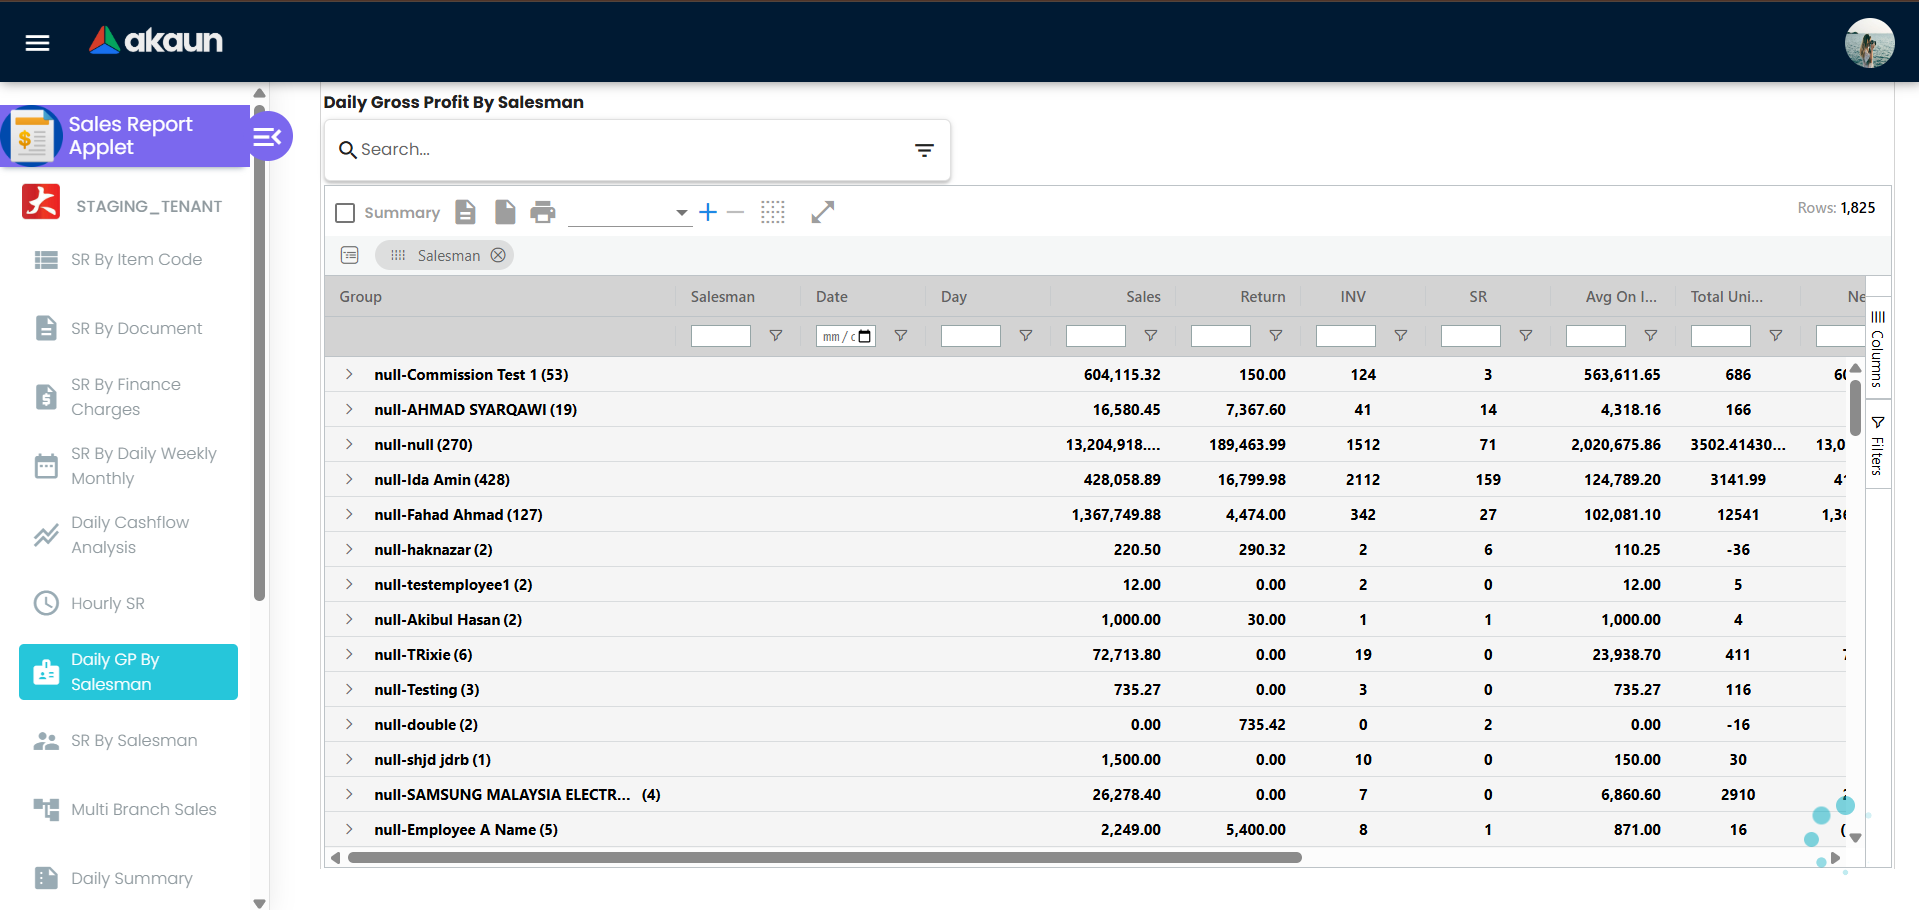
| Daily GP by Salesman | daily-gp-by-salesman | Gross profit and GP% by salesperson on a daily basis | Which days and which salespeople are driving (or dragging) profitability? |
| Multi-Branch Sales, Purchase & Collection | multi-branch-sales-purchase-collection | Consolidated view across branches for sales, purchases, and collections | How is each branch performing, and where are collections lagging? |
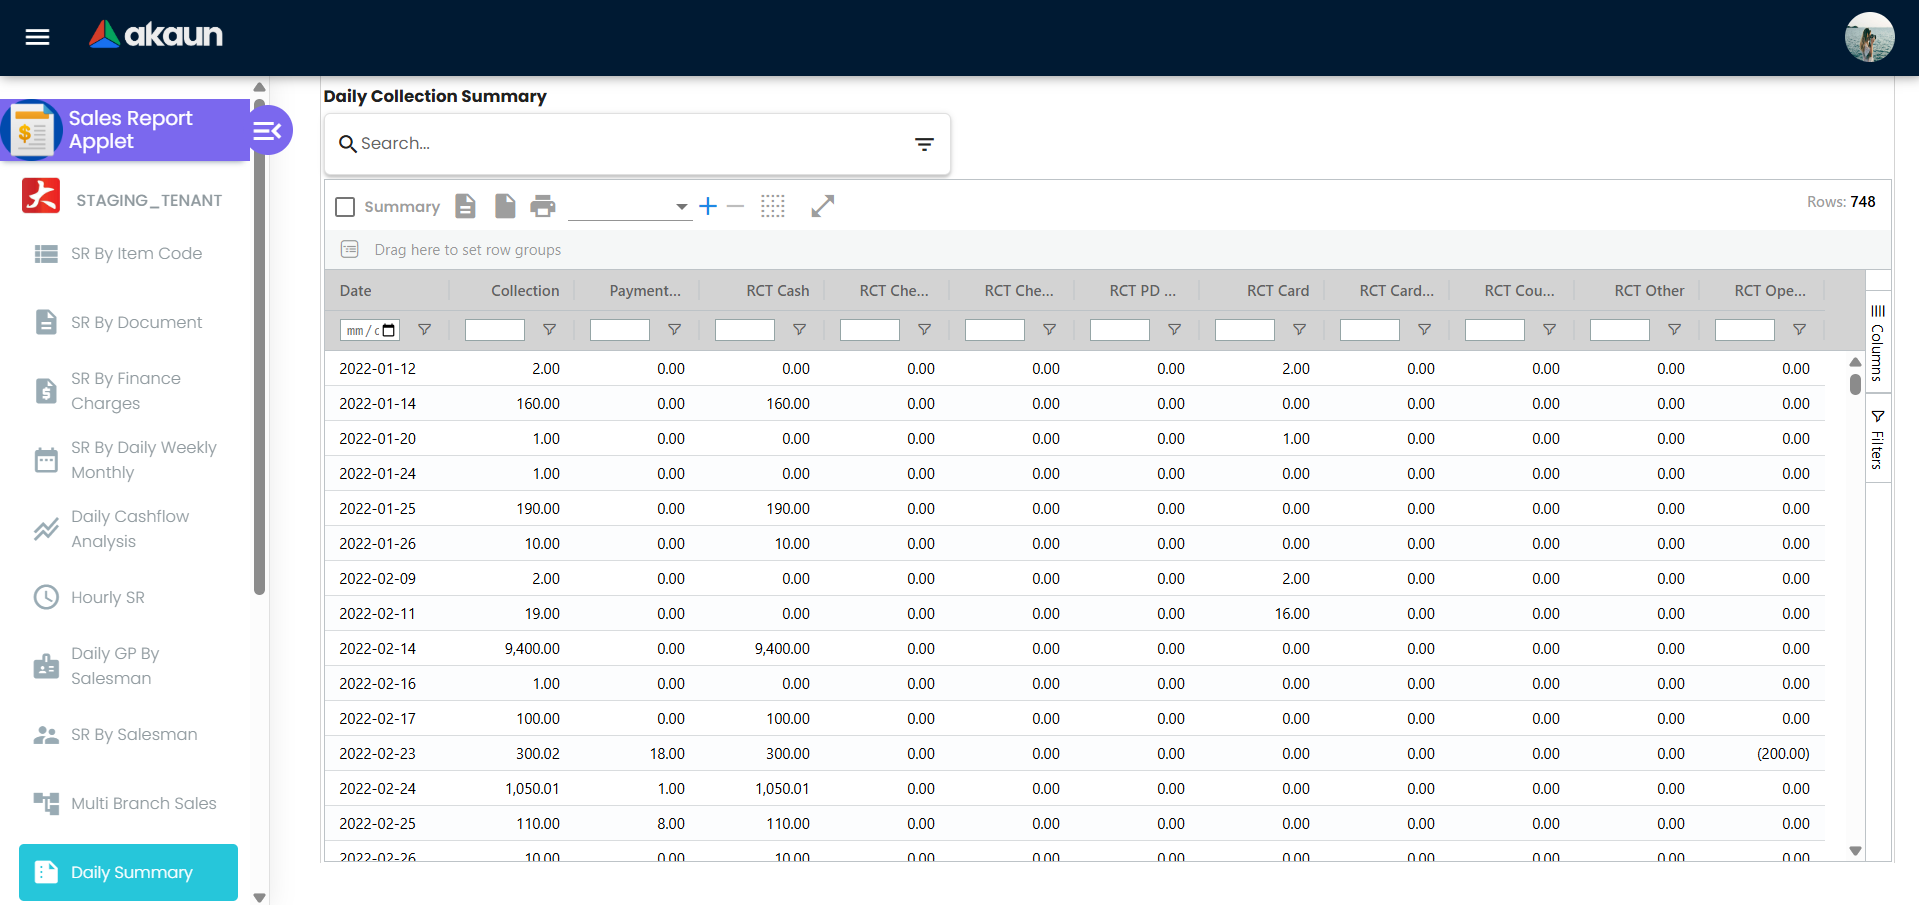
| Daily Collection Summary & Collection with Invoice Detail | daily-collection-summary, collection-with-invoice-detail | Collections by day, with drill-down to invoice-level detail | How much was collected today and which invoices were settled? |
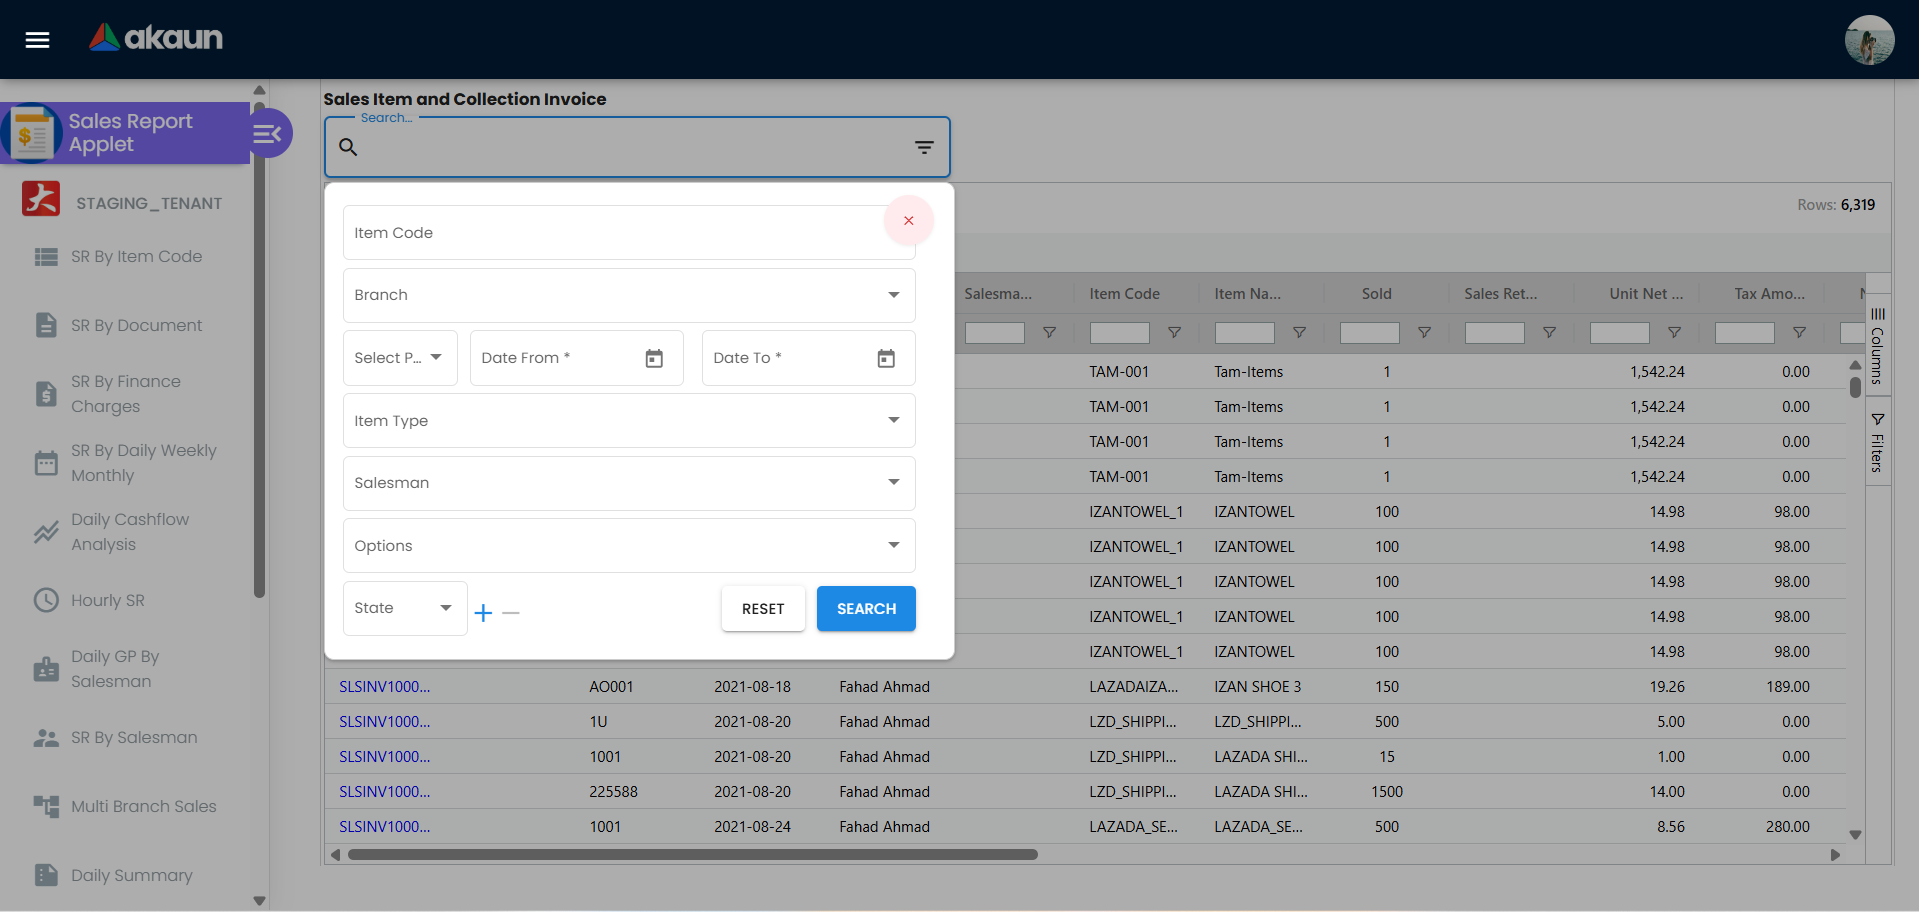
| Receipt with Credit Card & Sales Item Collection Invoice | receipt-with-credit-card, sales-item-collection-invoice | Card-based receipts and item-level collection details | How much of today’s sales were paid by card? Which items are tied to each collection invoice? |
These views all share a common pattern: advanced search at the top, a configurable ag-grid listing, and optional column visibility based on permissions.
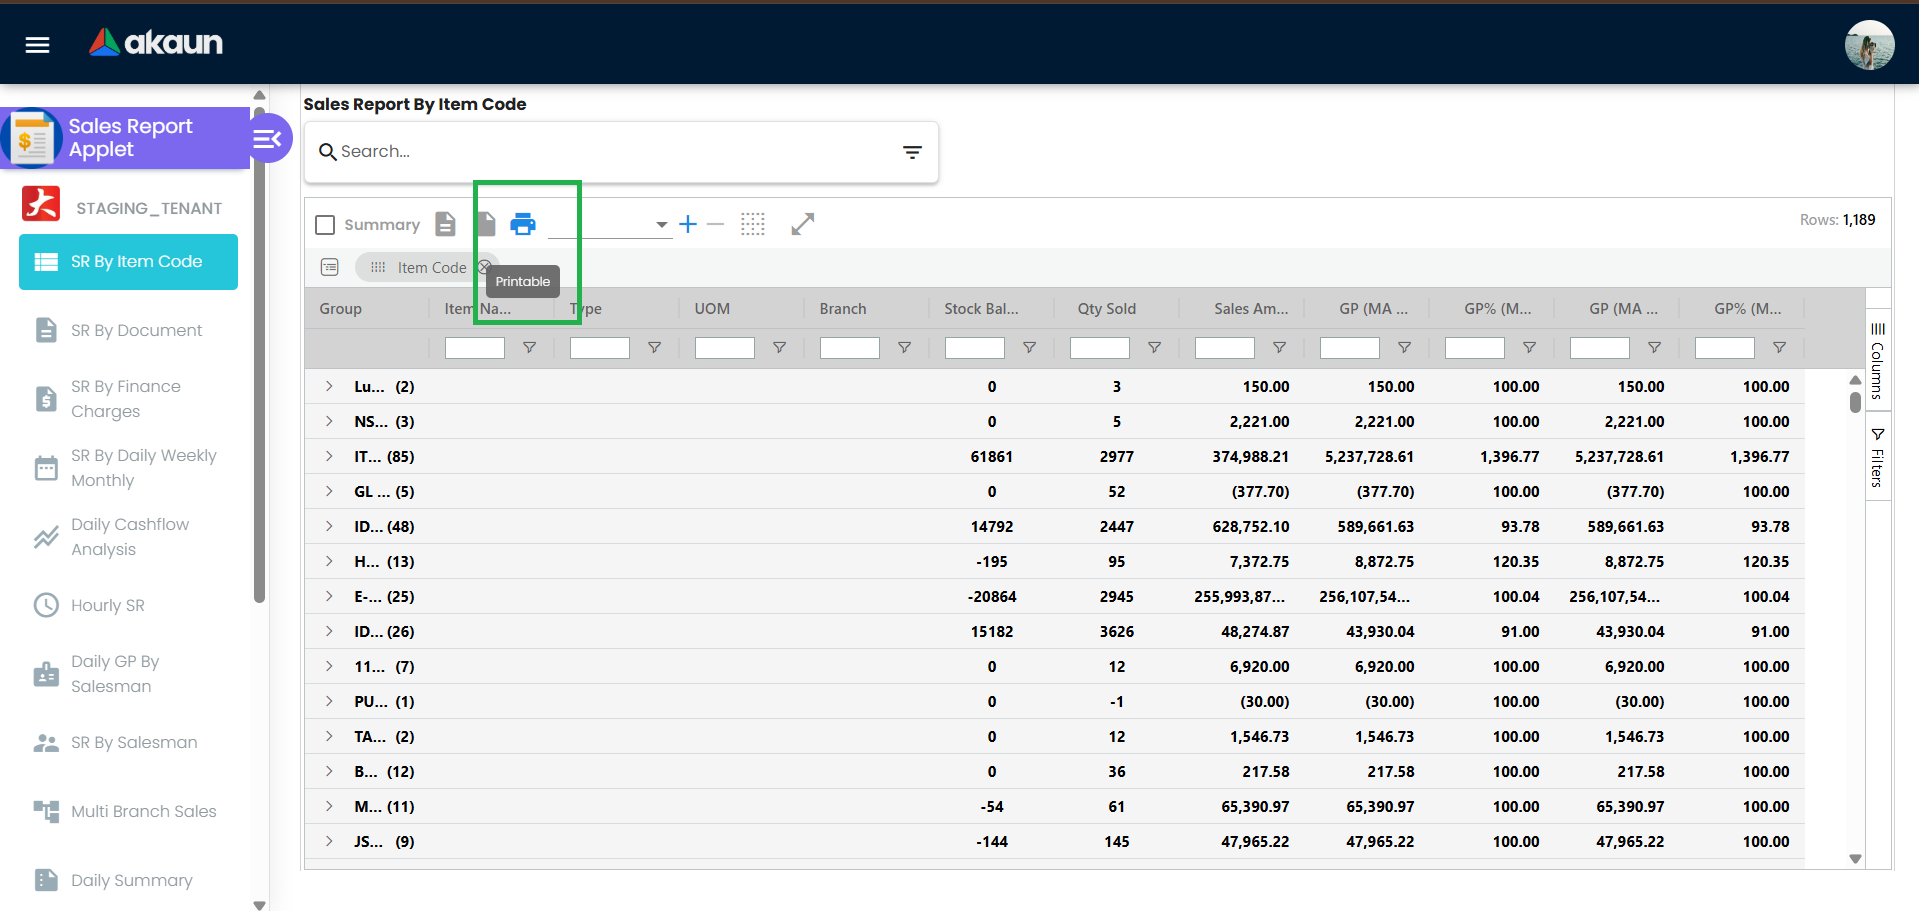
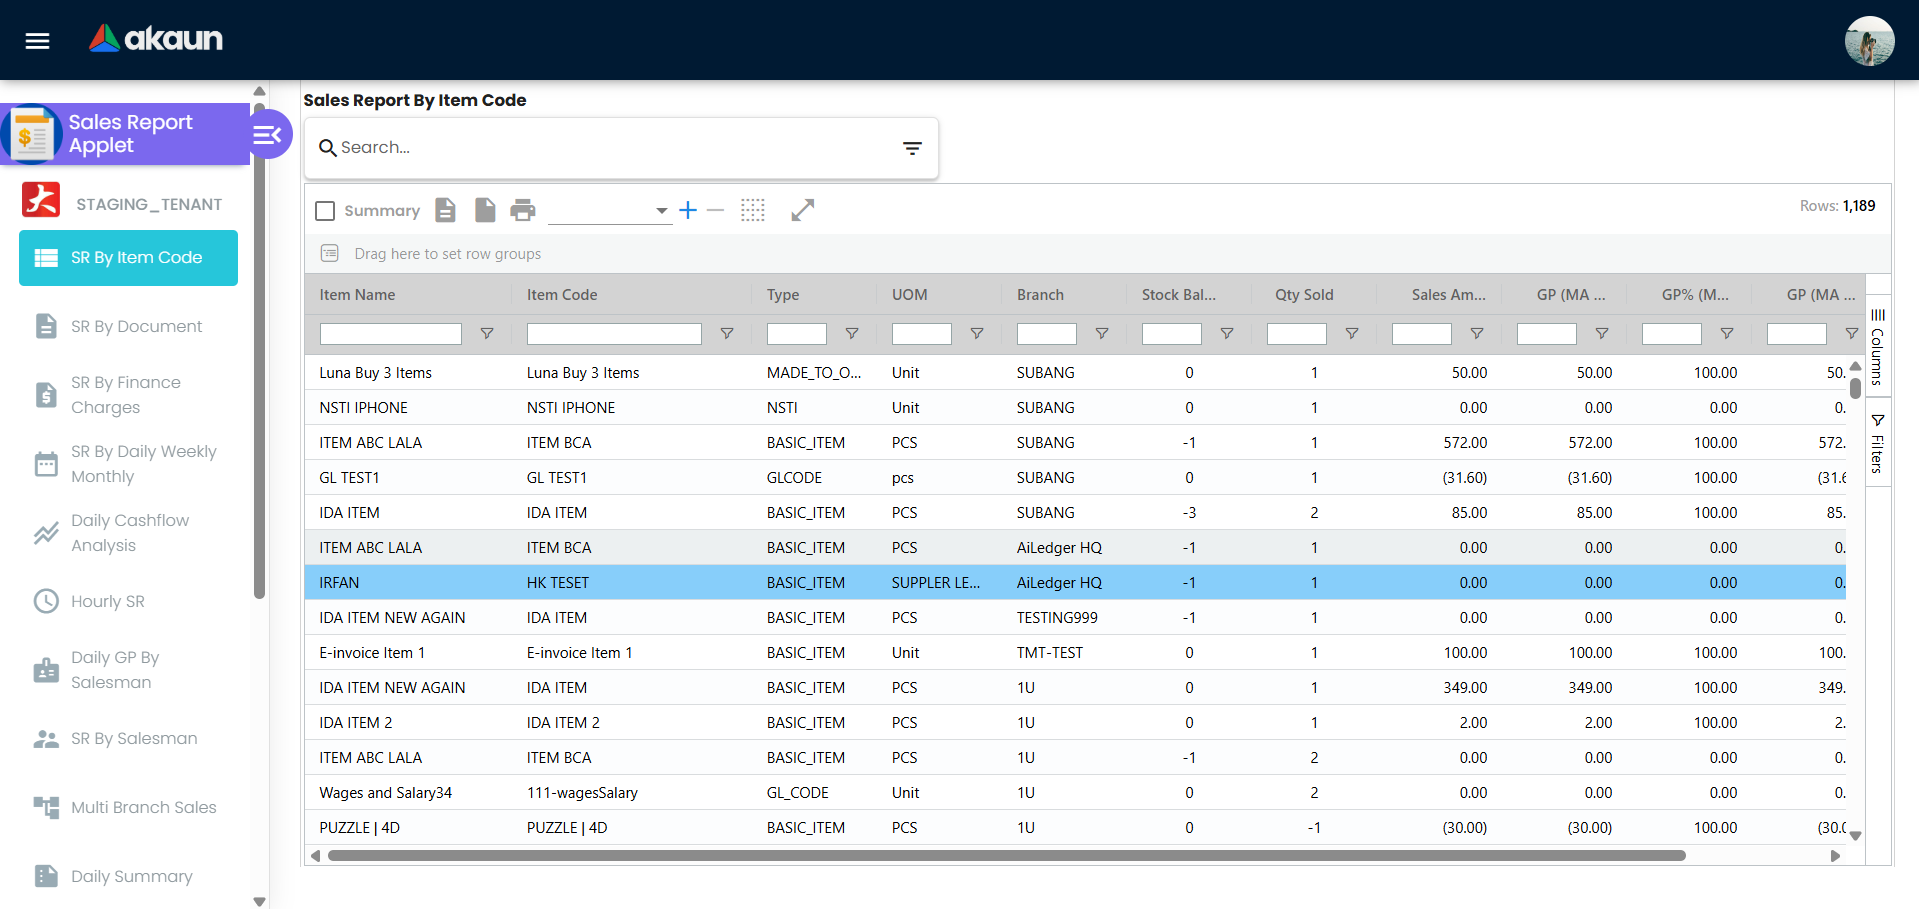
Sales Report by Item Code
Use Sales Report by Item Code when you want a detailed product lens on performance.
- See sales, returns, net sales, cost, GP, and GP% per SKU, with category breakdowns.
- Optionally include landed cost and landed GP for a more realistic margin picture.
- Ideal for product managers and inventory teams deciding which items to promote, phase out, or reprice.
- Route reference (for admins):
sales-report-by-item-code.
Sales Report by Salesman
Use Sales Report by Salesman to understand how each salesperson or team is performing.
- View net sales, cost, GP, GP%, and delta metrics per salesperson.
- Combine with Daily GP by Salesman to see profitability trends by day and by person.
- Great for sales managers tracking targets, coaching, and incentive plans.
- Route references:
sales-report-by-salesman,daily-gp-by-salesman.
Daily GP by Salesman
Use Daily GP by Salesman to see gross profit and GP% by salesperson on a daily basis.
- Identify which days and which salespeople drive or drag profitability.
- Complements the main Sales Report by Salesman with a time-sliced view.
- Route reference:
daily-gp-by-salesman.
Sales Report by Document
Use Sales Report by Document when you need invoice-level or order-level analysis.
- See sales grouped by document (invoices, orders) with document metadata.
- Identify which invoices or documents contribute most to revenue.
- Useful for finance reconciliation, follow-up, and audit trails.
- Route reference:
sales-report-by-document.
Daily Sales Report with Cashflow Analysis
Use Daily Sales Report with Cashflow Analysis when you care about both revenue and cash movement.
- Shows daily sales transactions with rich document metadata and payment information.
- Helps finance and operations see how sales translate into cash, by branch and customer.
- Useful for daily cashflow monitoring, reconciliation, and spotting collection issues early.
- Route reference:
daily-sales-report-cashflow.
Daily / Weekly / Monthly Summary
Use the Daily/Weekly/Monthly summary view when you want a clean time-based picture.
- Aggregate sales at the day, week, or month level.
- Quickly compare recent periods without diving into line-level detail.
- Helpful for management dashboards, performance reviews, and trend spotting.
- Route reference:
sales-report-by-daily-weekly-monthly.
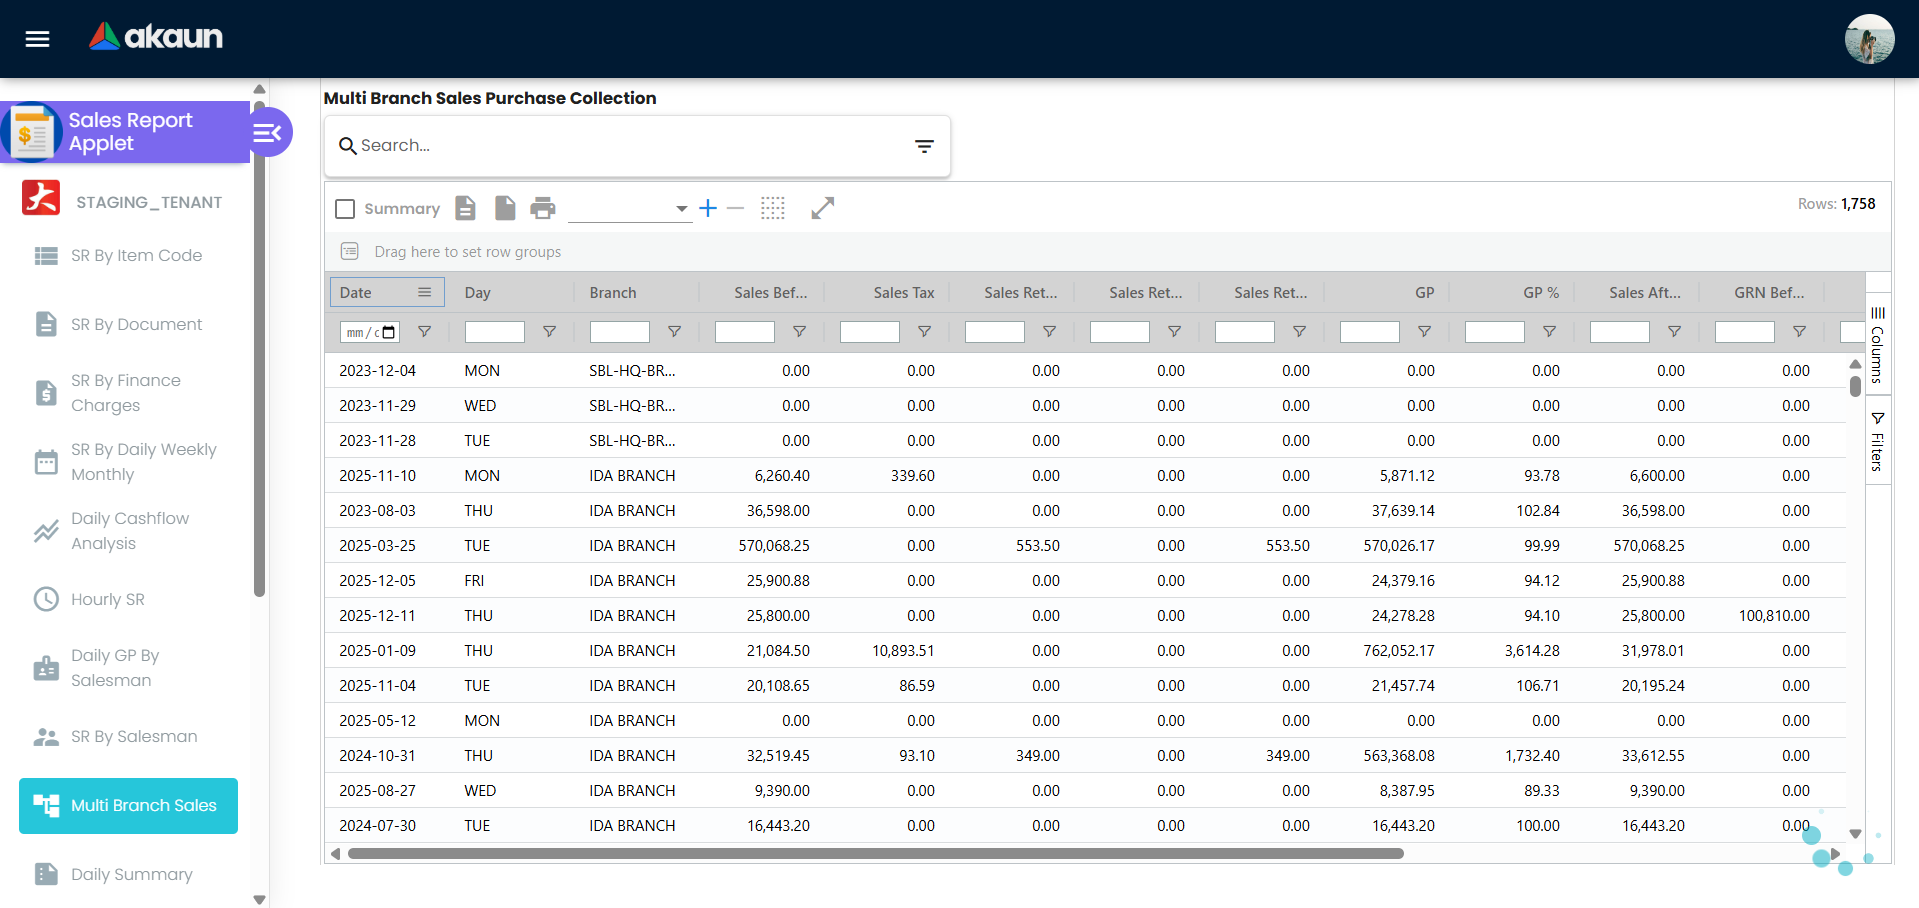
Multi-Branch Sales, Purchase & Collection
Use Multi-Branch Sales, Purchase & Collection to see the bigger picture across locations.
- Consolidates sales, purchases, and collections by branch in a single view.
- Makes it easy to compare branches, identify underperforming locations, and plan support or investment.
- Often used by regional managers and finance teams for branch reviews.
- Route reference:
multi-branch-sales-purchase-collection.
Advanced Search & Filtering
Improves efficiency and enables precise data analysis.
Narrow down reports so you see only what matters:
- By calculation set – Use the correct basis (e.g., invoiced sales, delivered sales) as configured in the applet
- By type – Filter by document type, transaction type, or category
- By date range – Daily, weekly, monthly, custom range
- By branch, team, product, or customer – Focus on a specific segment
Consistent use of filters ensures that comparisons and exports are accurate and aligned across teams.
Configuration & Settings
Configure how sales data is aggregated, who can see what, and how reports behave.
Report Definitions & Calculation Sets (Settings > Sales Report)
Where: Settings > Sales Report (or equivalent) — Calculation Sets / Report Definitions
What: A calculation set defines how sales figures are calculated—for example, by invoice date, delivery date, or document type—and which source documents feed the report. This ensures that “sales” means the same thing across the organization (e.g., invoiced vs delivered). Everyone using the same set gets comparable numbers.
Typical options:
- Calculation set name and description
- Source (e.g., invoiced sales, delivery orders)
- Date basis (document date, posting date, etc.)
- Inclusion/exclusion of certain document types
Report Types & Dimensions (Settings > Sales Report)
Where: Settings > Sales Report — Report Types / Dimensions
What: Configure which dimensions are available (by salesman, by document, by item code, by serial number) and any report templates or default views. Controls what appears in multi-dimensional reporting and dropdowns.
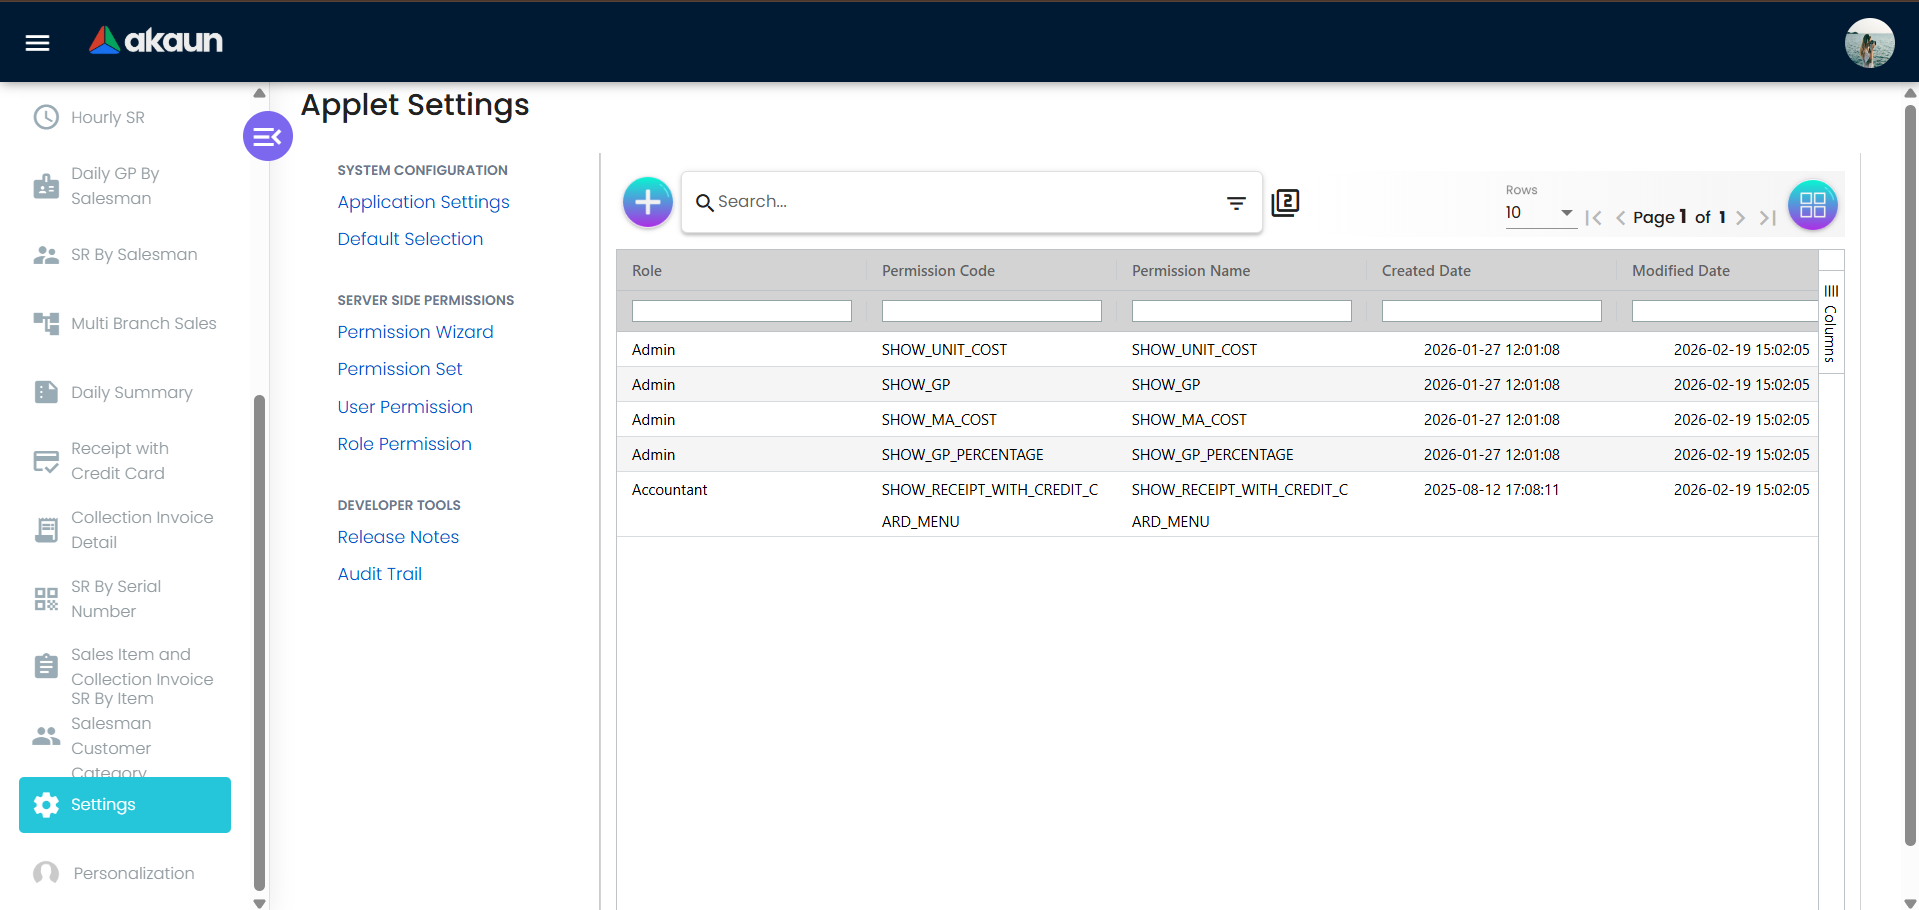
Access & Permissions (Settings > Access or role/permission settings)
Where: Settings > Access or Role / Permission settings for the Sales Report Applet
What: Define who can:
- View sales reports (all branches vs own branch, all team vs own)
- Export reports
- Change calculation set or sensitive filters
Default Periods & Favorites (Settings > Sales Report)
Where: Settings > Sales Report — Default Settings or User Preferences
What: Set default date range (e.g., current month), default calculation set, and optional favorite views so users land on the right report quickly.
Export & Integration (Settings > Sales Report)
Where: Settings > Sales Report — Export Formats / Integration
What: Configure export formats (e.g., PDF, Excel) and any integration with accounting, inventory, or BI tools so that reports are export-ready and consistent with downstream systems.
FAQ
Q: Why do my sales figures differ from the finance team’s numbers?
A: You are likely using a different calculation set or date range. Finance often uses a set based on invoice date or posting date. In Sales Report, select the same calculation set and period that finance uses for reconciliation, and ensure filters (branch, document type) match. If numbers still differ, compare source documents or check with your admin.
Q: How do I run a report for one branch only?
A: Use the Branch (or Location) filter on the main Sales Report screen. Select the branch you want before applying the date range and calculation set. The listing and totals will then show only that branch’s sales.
Q: How do I compare this month to last month (or this year to last year)?
A: Use the period selector and any comparison or variance option in the Sales Report. Select the two periods (e.g., This Month vs Last Month); the report will show both figures and variance where the applet supports it. If there is no comparison view, run two reports (one per period) and compare the exported totals.
Q: Can I export to Excel for month-end close?
A: Yes. Open Sales Report, set the calculation set and date range to match your closing period, apply any filters (e.g., branch), then click Export and choose Excel (or the format your finance team uses). Use the same settings every month for consistent month-end reports.
Q: How do I see only my own sales as a salesperson?
A: If your organization uses My Sales, open that from the sidebar—it shows only your transactions. Otherwise, open Sales Report, use the By Salesperson (or similar) filter, and select your name. If your role is restricted to “own” data, you may already see only your sales by default.